Previous | Close | Next
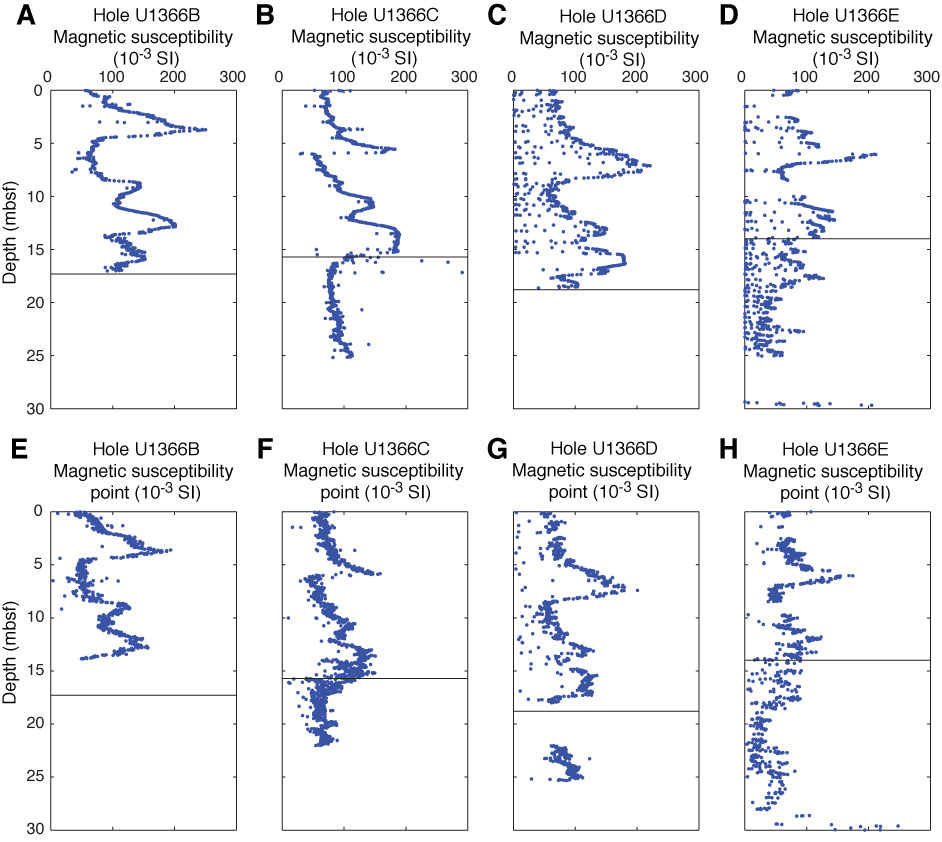
Figure F15. Plots of (A–D) magnetic susceptibility measurements made on the Whole-Round Multisensor Logger and (E–H) point magnetic susceptibility measurements made on the Section Half Multisensor Logger.
Previous | Close | Next | Top of page