Previous | Close | Next
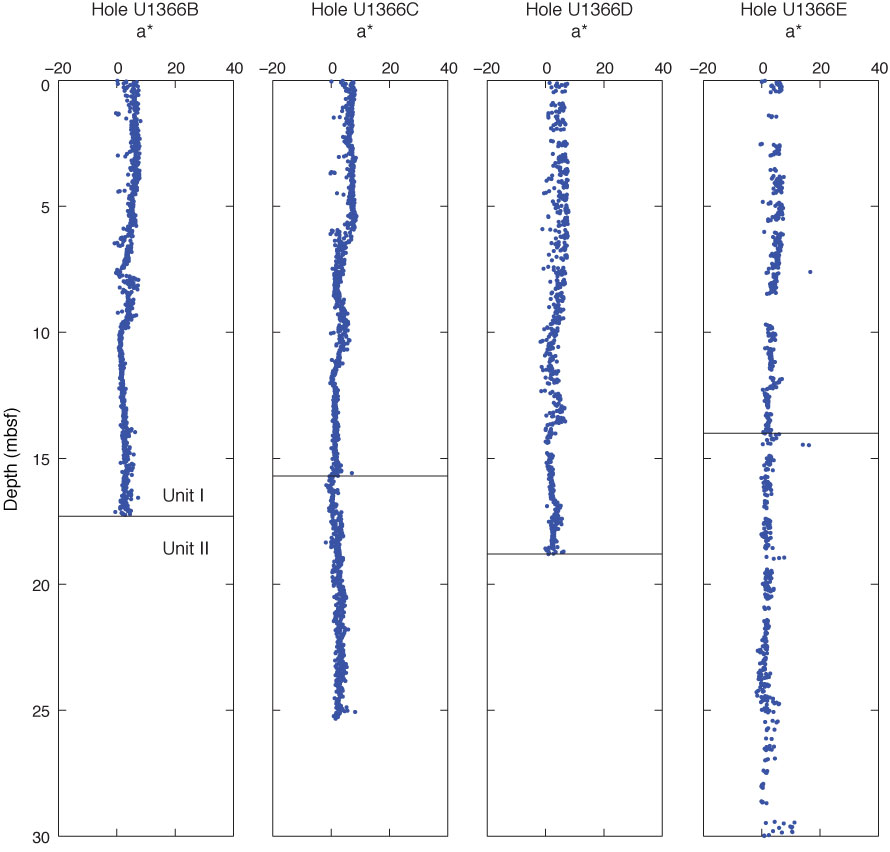
Figure F23. Plots of color spectrometry a* values, Holes U1366B–U1366E.
Previous | Close | Next | Top of page