Previous | Close | Next
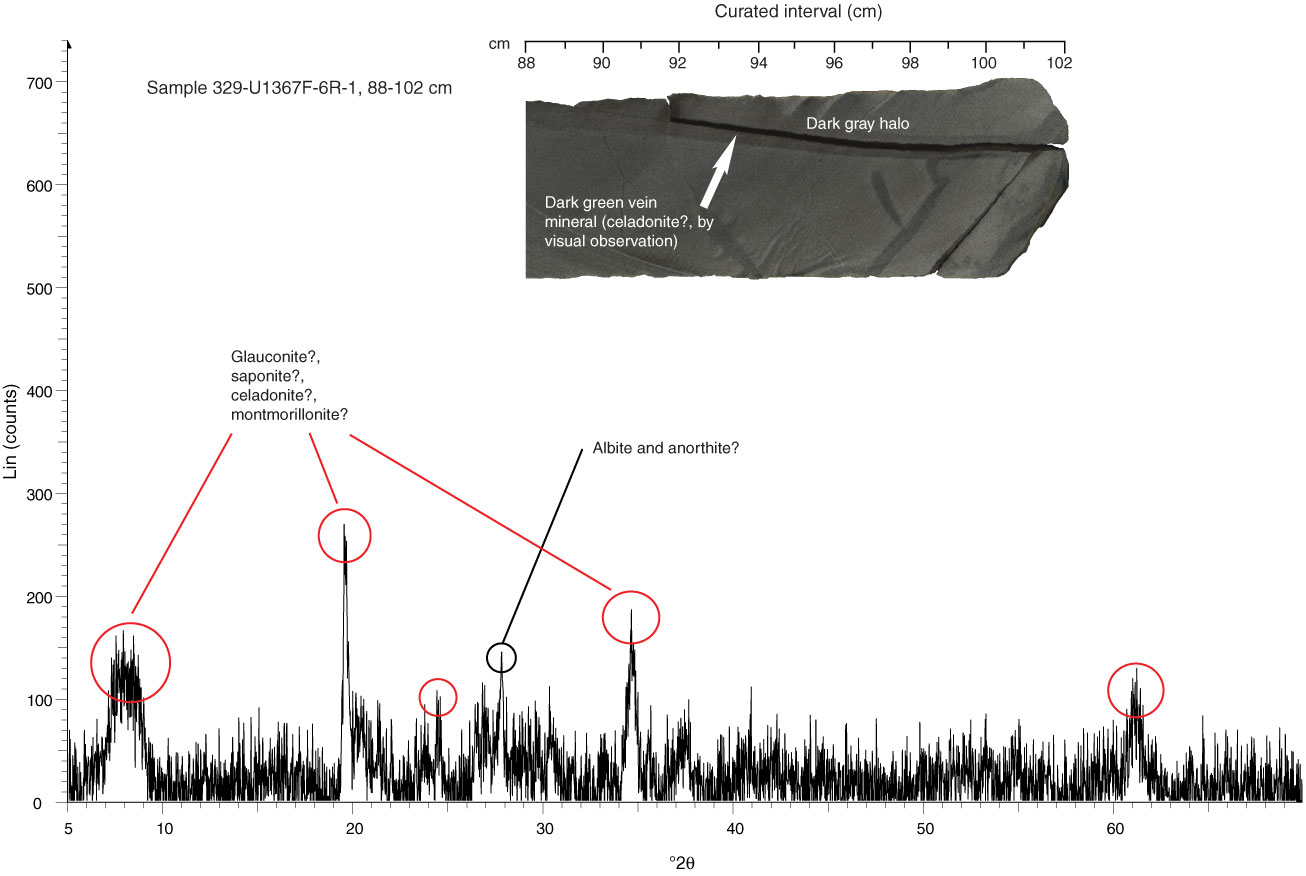
Figure F15. X-ray diffractogram for dark green clay mineral. Speculative interpretation of main peaks are included (Sample 329-U1367F-6R-1, 88–102 cm).
Previous | Close | Next | Top of page