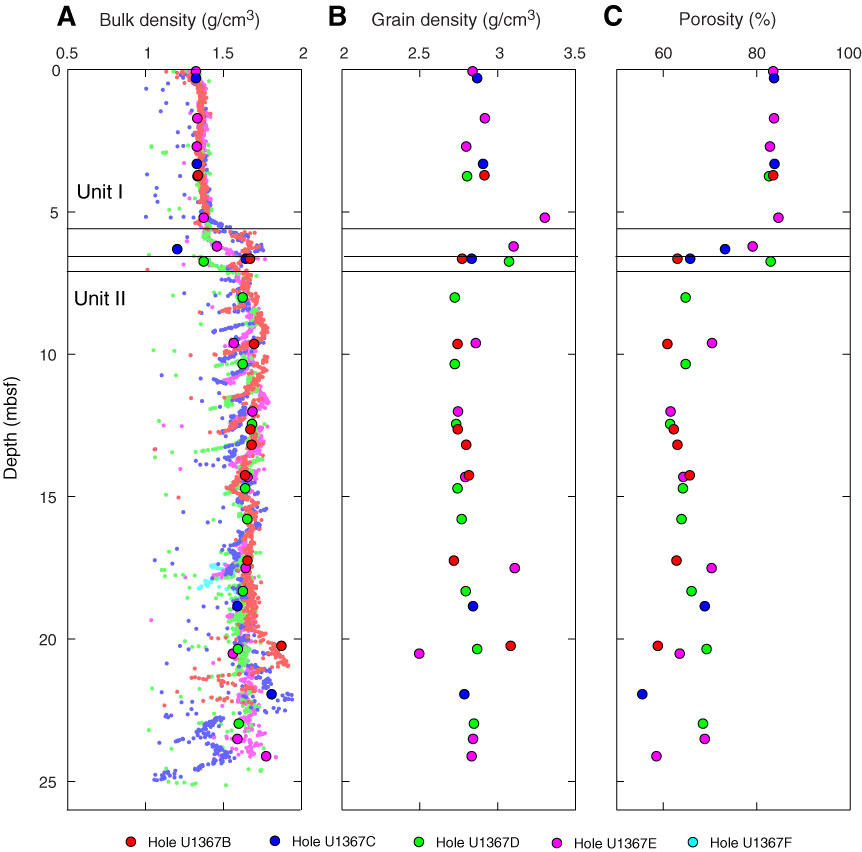
Figure F19. Plots of combined results of density and porosity measurements in sediments, Site U1367. A. Gamma ray attenuation density measured with Whole-Round Multisensor Logger and wet bulk density measured on discrete samples using the mass/volume methods (large circles). B. Grain density measured on discrete samples using the moisture and density (MAD) mass/volume methods. C. Porosity determined using MAD Method C. The upper horizontal line shows the contact between lithologic Units I and II for Holes U1367B and U1367C, the intermediate line corresponds to the contact for Hole U1367E, and the lower horizontal line corresponds to the contact in Hole U1367D.

Previous | Close | Next | Top of page