Previous | Close | Next
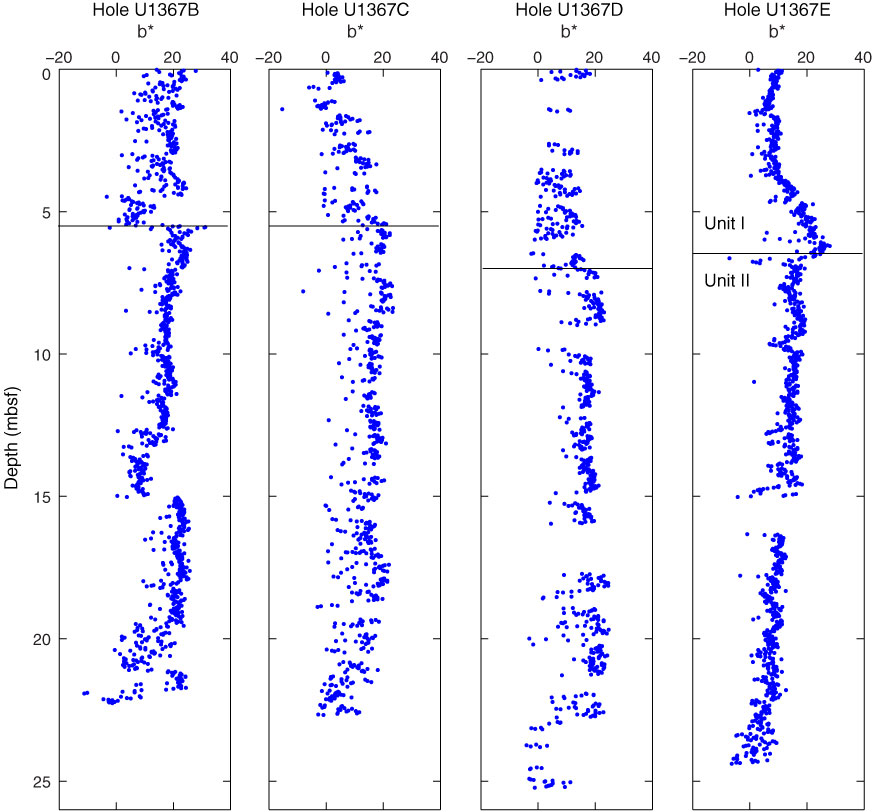
Figure F28. Plots of color spectrometry b* values, Site U1367.
Previous | Close | Next | Top of page