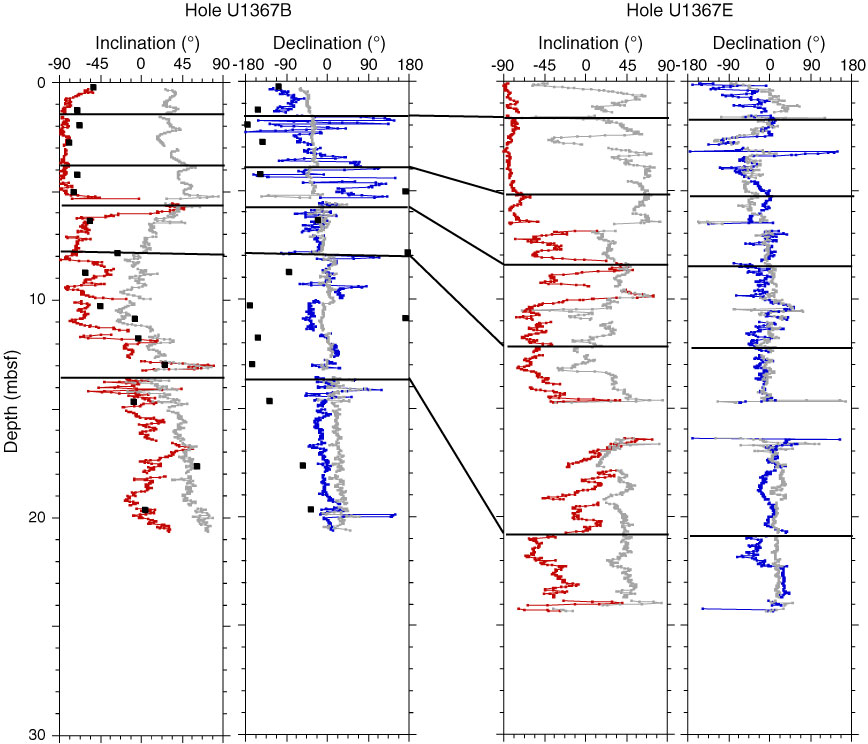
Figure F34. Correlation of the polarity records between Holes U1367B and U1367E. Inclination (red) and declination (blue) data are after the 20 mT AF demagnetization step. Gray = measurement before demagnetization. Black lines indicate correlation using the magnetic susceptibility data between holes. Black squares = magnetic directions of discrete cube samples from the working-half cores.
Previous | Close | Next | Top of page