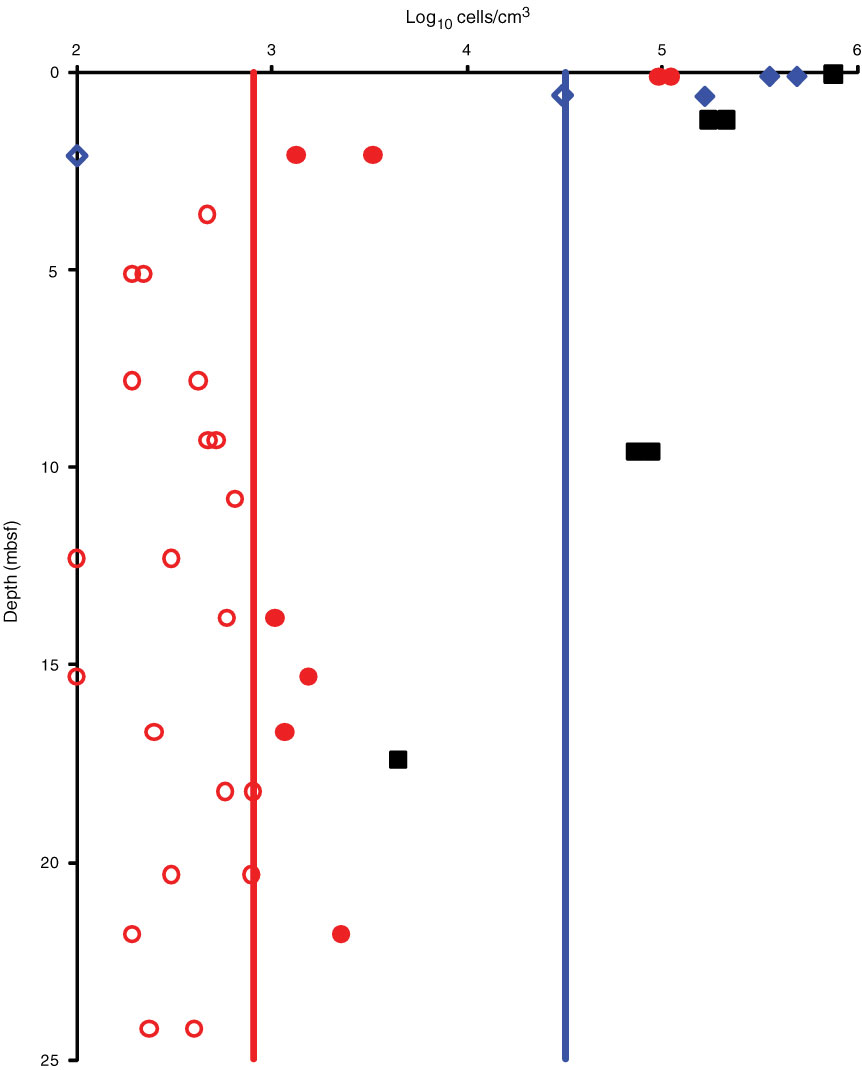
Figure F39. Plot of abundance of microbial cells and virus-like particles in Site U1367 sediment as determined by epifluorescence microscopy. Counts below the blank are shown as 102 cells/cm3 in order to present them in the graph. See “Microbiology” in the “Methods” chapter (Expedition 329 Scientists, 2011a) for a detailed description of the blank and minimum detection limit (MDL) calculation. Red line = MDL for cell counts from extracts, blue line = MDL for nonextracted samples, solid red circles = abundances above MDL, open red circles = direct counts below MDL, solid black squares = VLP counts, solid blue diamonds = nonextracted direct counts above MDL, open blue diamonds = nonextracted direct counts below MDL.
Previous | Close | Next | Top of page