Previous | Close | Next
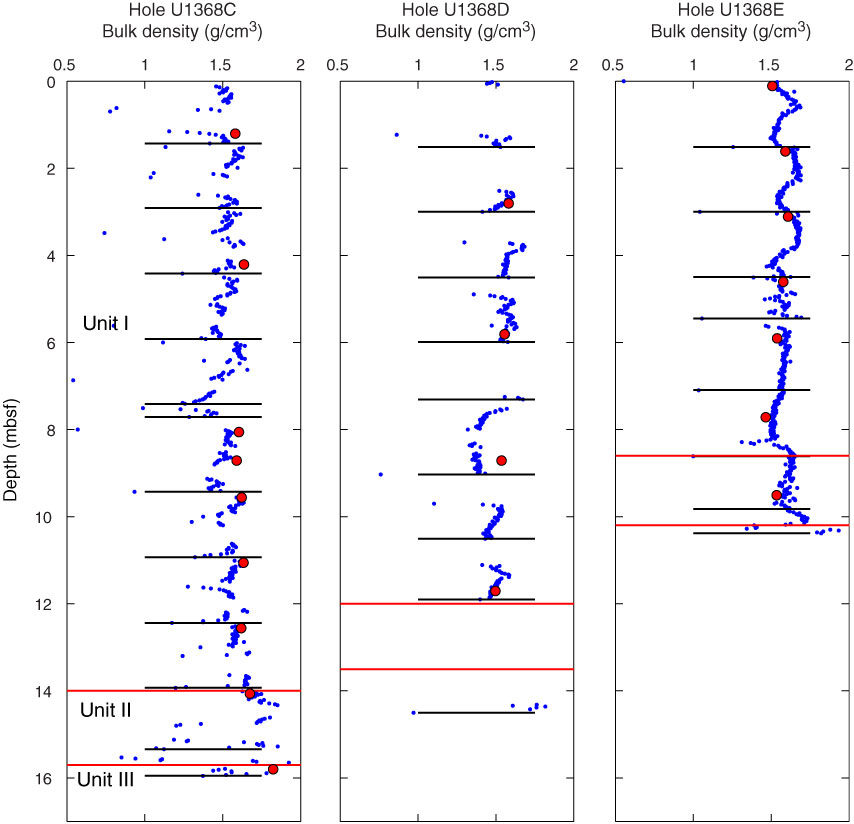
Figure F32. Plots of bulk density data, Site U1368. Red lines indicate lithologic unit boundaries, black lines indicate section breaks, red circles show bulk density derived from MAD measurements.
Previous | Close | Next | Top of page