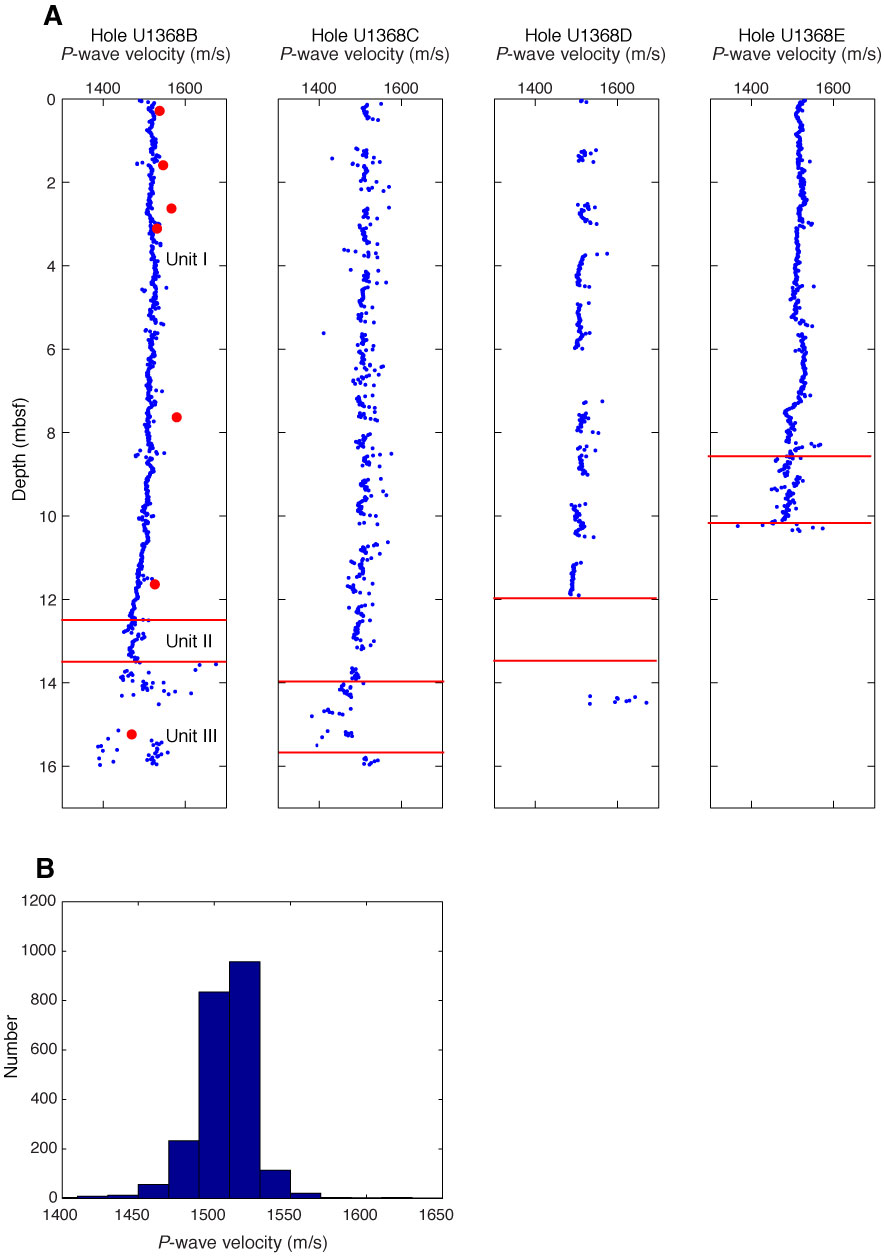
Figure F39. A. Plots of compressional wave velocity measured with the Whole-Round Multisensor Logger, Site U1368. Red circles indicate discrete measurements of P-wave velocity along x-axis. B. Histogram of sediment P-wave velocity from all holes.
Previous | Close | Next | Top of page