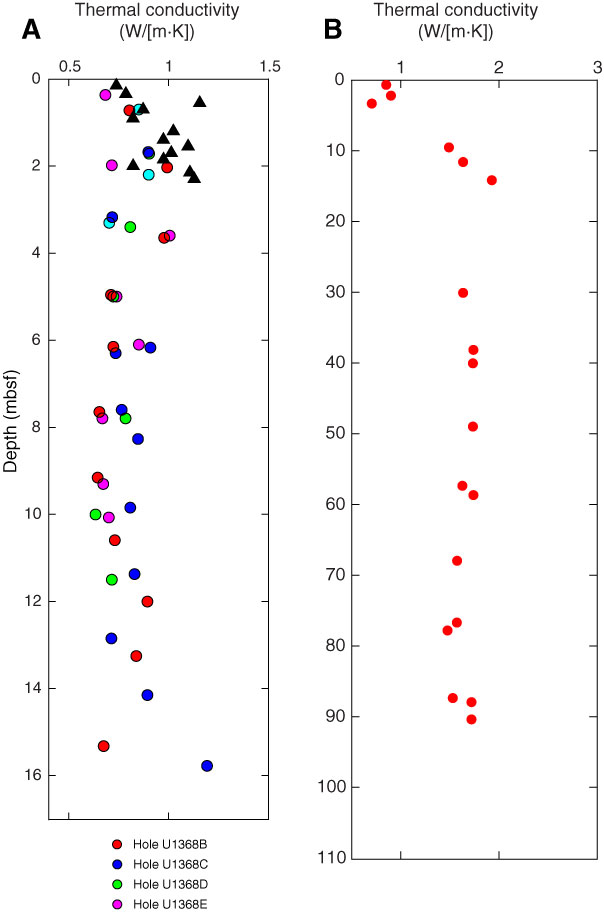
Figure F43. Plots of thermal data, Site U1368. A. Thermal conductivity values on sediments as a function of depth. Black triangles indicate values collected during KNOX-02RR site survey cruise. B. Hole U1368F thermal conductivity values.

Previous | Close | Next | Top of page