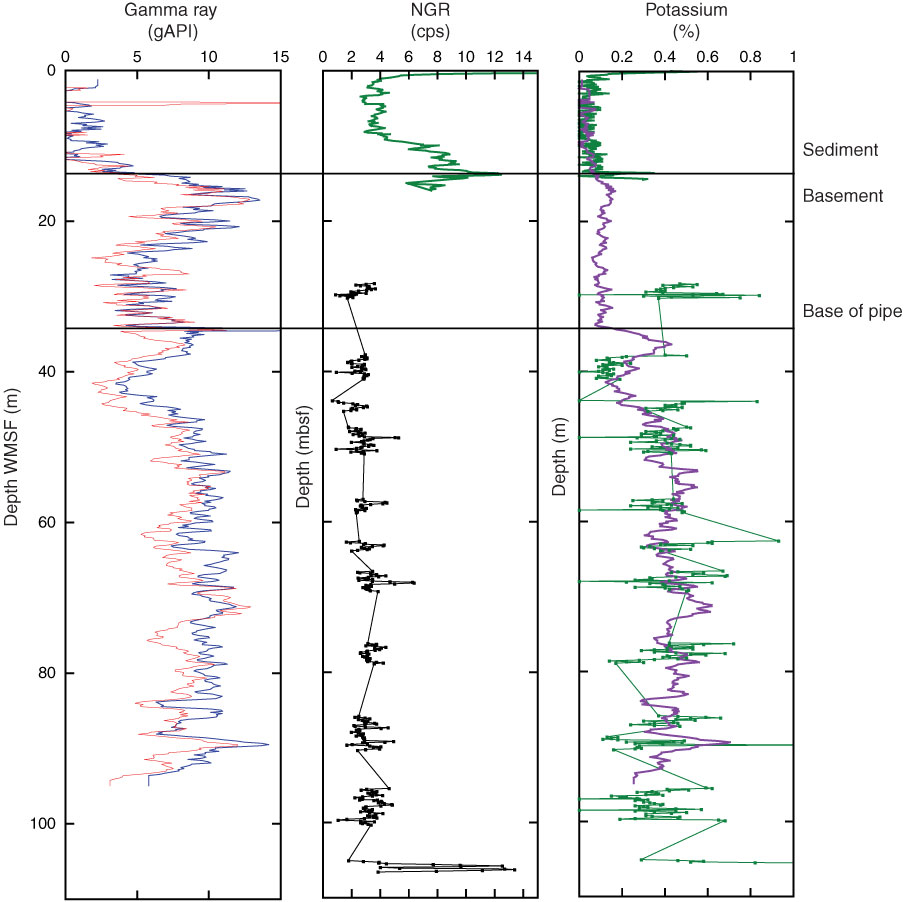
Figure F50. Plots comparing downhole total natural gamma radiation (NGR; red and blue), sediment (green) and basement (black) NGR, and total (purple) and whole-core section (green) potassium measurements, Hole U1368F. Total gamma ray data are corrected by a factor 3.5 to compensate for attenuation of the signal by the bottom-hole assembly.
Previous | Close | Next | Top of page