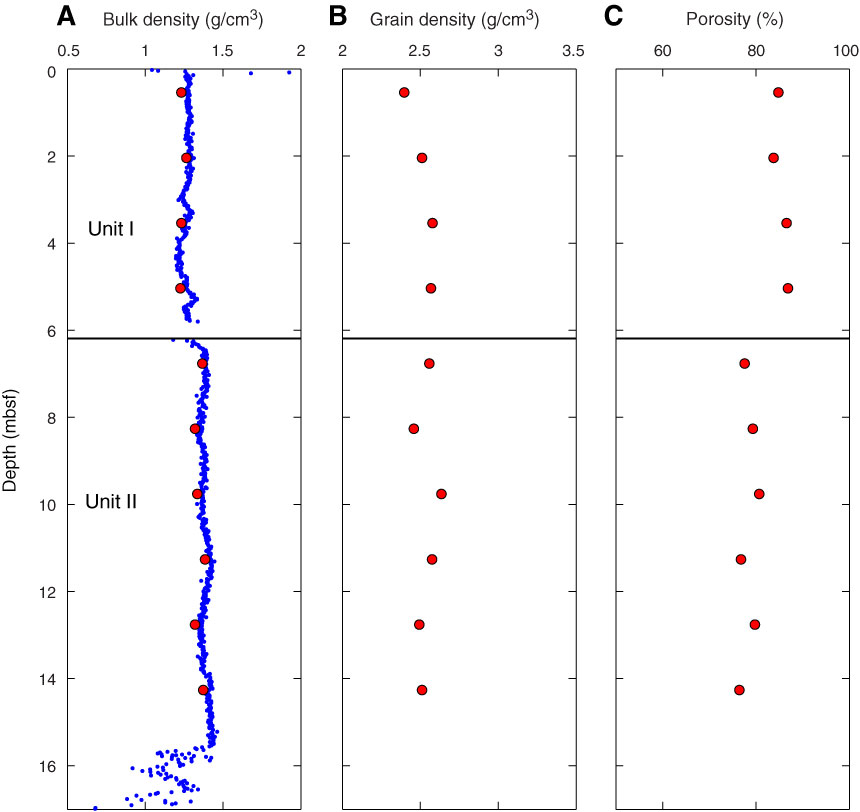
Figure F14. Plots of moisture and density (MAD) measurements, Hole U1369B. A. Bulk density. Red = bulk density derived from MAD Method C, blue = bulk density derived from gamma ray attenuation. B. Grain density. C. Porosity.
Previous | Close | Next | Top of page