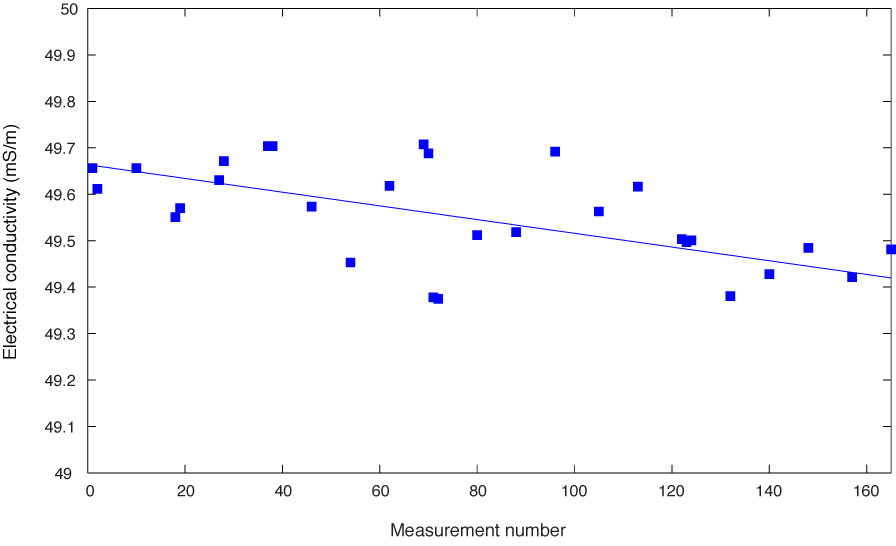
Figure F18. Plot of electrical conductivity measured on surface seawater standard, Site U1369. Line shows best linear fit to the data. The best fitting slope and y-intercept are –1.5 × 10⁻³ mS/m/measurement number and 49.66 mS/m, respectively.
Previous | Close | Next | Top of page