Previous | Close | Next
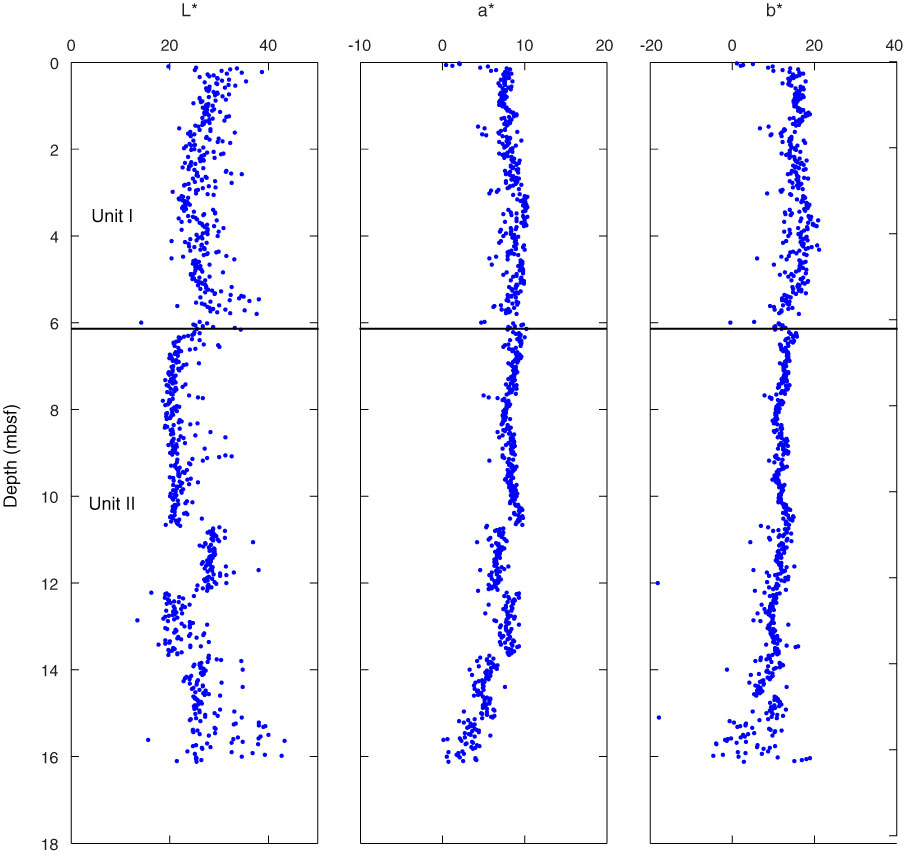
Figure F21. Plots of color spectrometry values, Hole U1369B.
Previous | Close | Next | Top of page