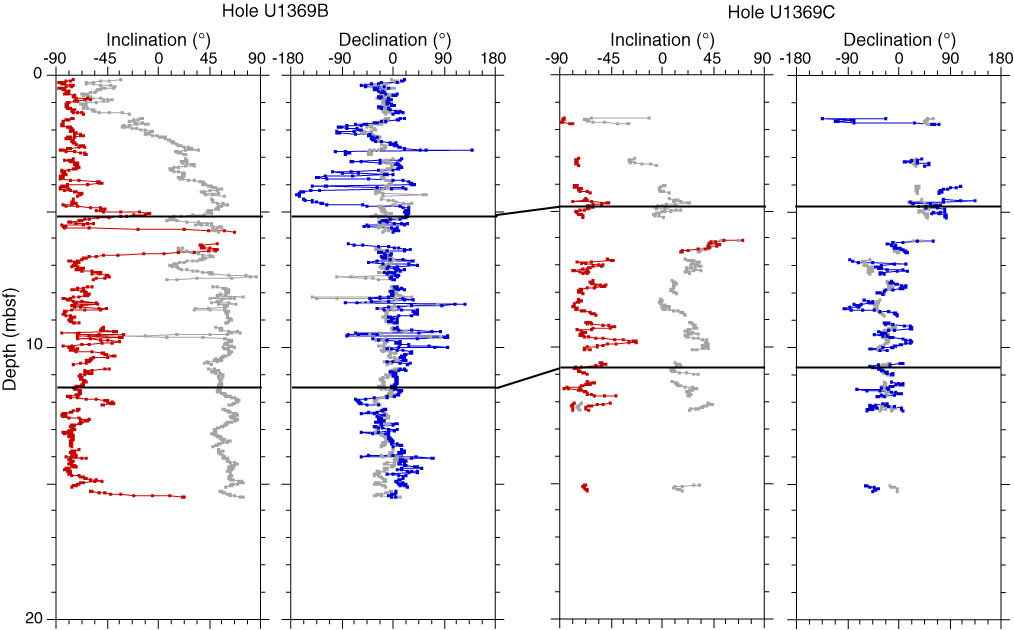
Figure F26. Correlation of polarity records between Holes U1369B and U1369C. Inclination (red) and declination (blue) after the 20 mT AF demagnetization step. Black lines indicate correlation points between holes. Gray = measurement before demagnetization.
Previous | Close | Next | Top of page