Previous | Close | Next
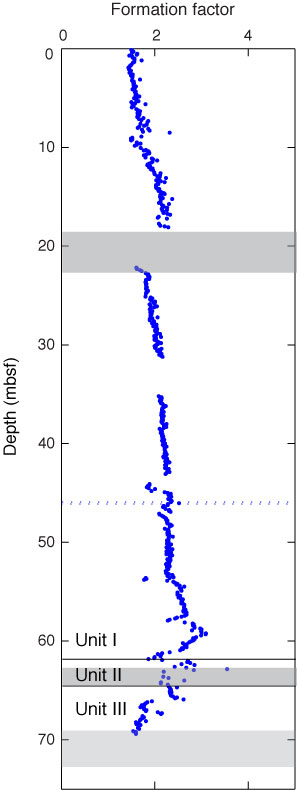
Figure F20. Plot of formation factor as a function of depth, Hole U1370D. Shaded regions denote areas of disturbed core.
Previous | Close | Next | Top of page