Previous | Close | Next
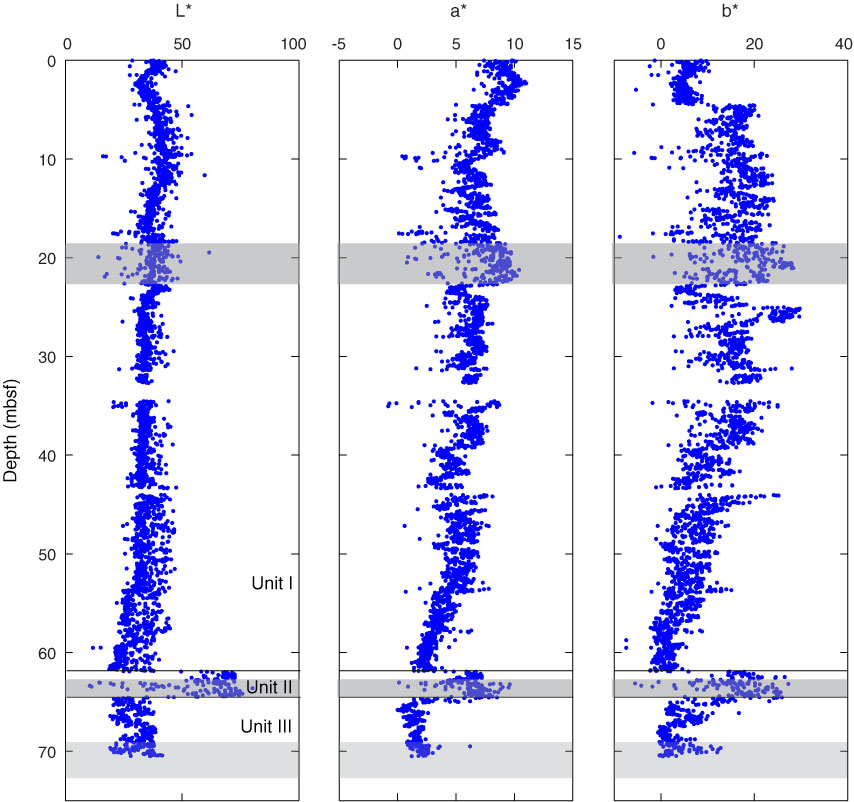
Figure F23. Plots of color spectrometry values, Hole U1370D. Shaded regions denote areas of disturbed core.
Previous | Close | Next | Top of page