Previous | Close | Next
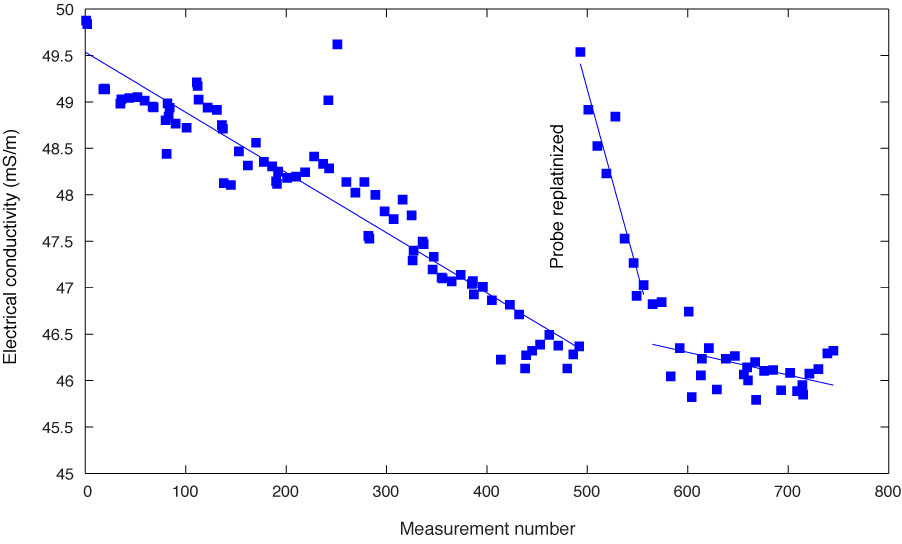
Figure F17. Plot of electrical conductivity measured on surface seawater standard, Site U1371. Lines show optimum linear fit to data.
Previous | Close | Next | Top of page