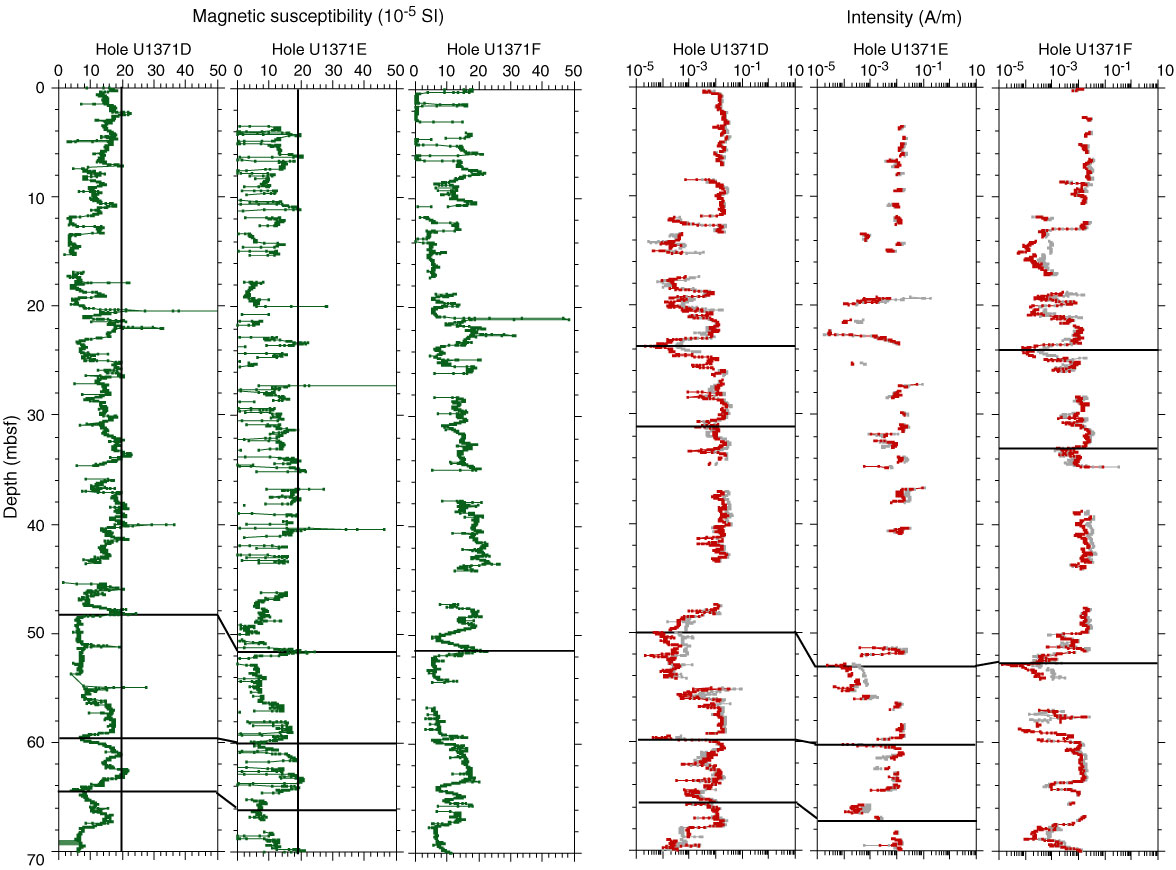
Figure F29. Results of hole-to-hole correlation using magnetic susceptibility (green) and magnetic intensity (red) data from Holes U1371D–U1371F. Black lines indicate correlation points between holes. Gray = measurement before demagnetization.
Previous | Close | Next | Top of page