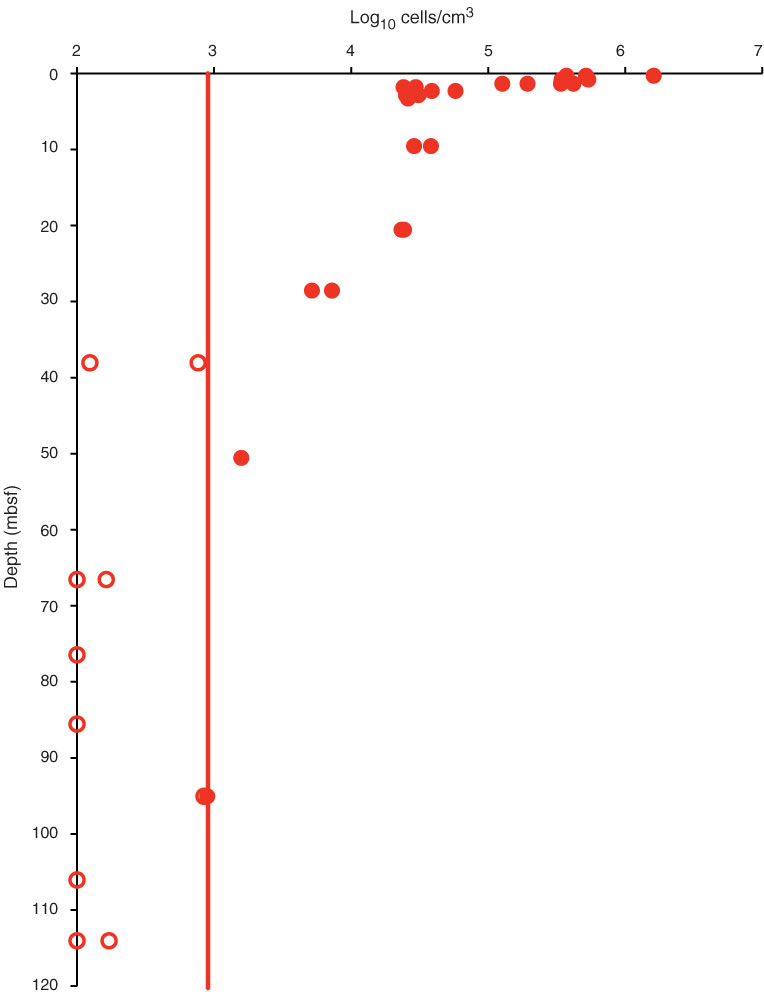
Figure F37. Plot of microbial cell abundance in Site U1371 sediment determined by epifluorescence microscopy. Only cell extracts were processed at this site. Direct counts below the blank were set to 102 cells/cm3 in order to present them in the graph. See “Microbiology” in the “Methods” chapter (Expedition 329 Scientists, 2011a) for a detailed description of the blank and minimum detection limit (MDL) calculation. Red line = MDL, solid circles = microbial cell abundances above the MDL, open circles = counts below MDL.
Previous | Close | Top of page