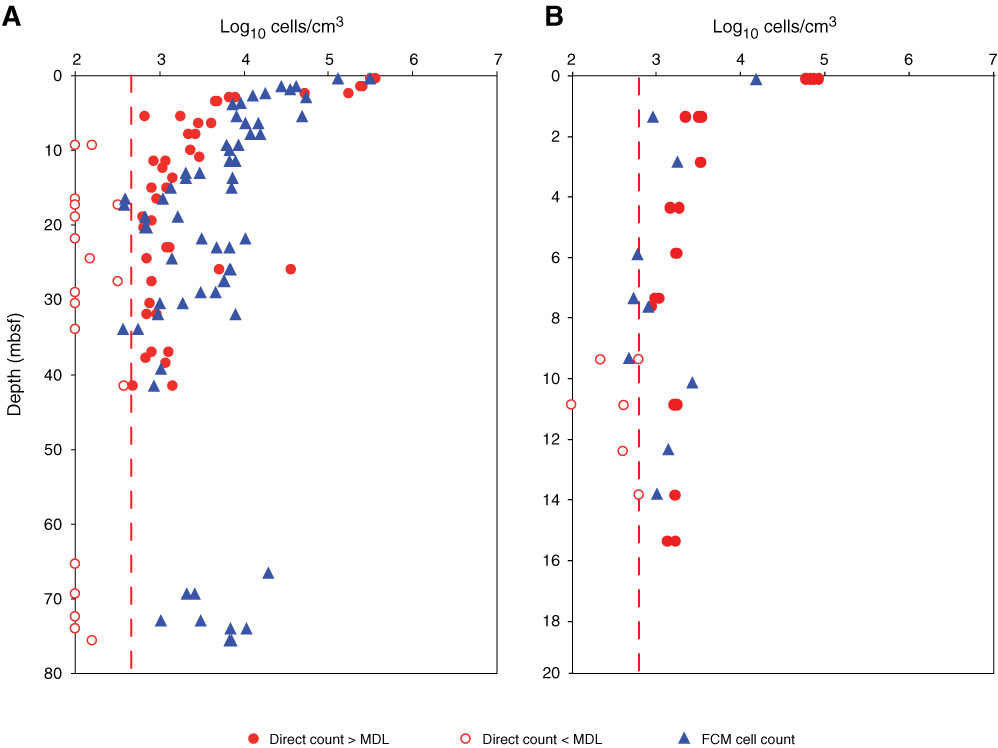
Figure F1. Plots of direct microscopic cell counts in South Pacific Gyre sediment using epifluorescence microscopy and flow cytometry (FCM). Red dotted line indicates minimum detection limit (MDL; see “Microbiology” in the “Site U1365” chapter and “Microbiology” in the “Site U1368” chapter [Expedition 329 Scientists, 2011b, 2011c). FCM-based cell count used Protocols FCM-A and FCM-D for Sites U1365 and U1368, respectively. Note that FCM-based counts have no statistic support because nonbiological background fluorescent signals inconstantly appeared in the same fluorescent range of SYBR-stained cells (see text). A. Site U1365. B. Site U1368.
Close | Next | Top of page