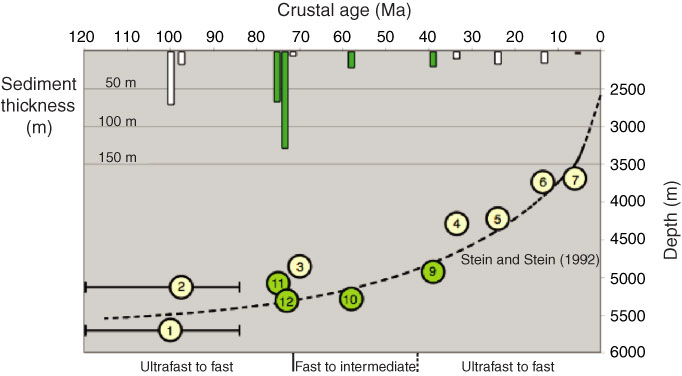
Figure F10. Plot of crust age, spreading rate, and sediment thickness of survey sites. White sediment columns and yellow circles indicate northern transect sites. Green sediment columns and green circles indicate southern transect sites.

Previous | Close | Next | Top of page