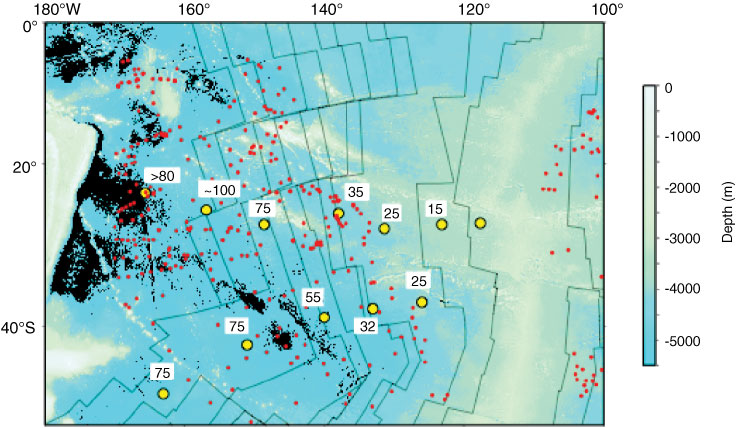
Figure F2. Seafloor bathymetry of the South Pacific Gyre (Smith and Sandwell, 1997). Yellow circles indicate coring sites with associated crustal ages in Ma. Magnetic lineations are shown at an interval of 10 Ma. Red circles indicate existing heat flow data.
Previous | Close | Next | Top of page