Previous | Close | Next
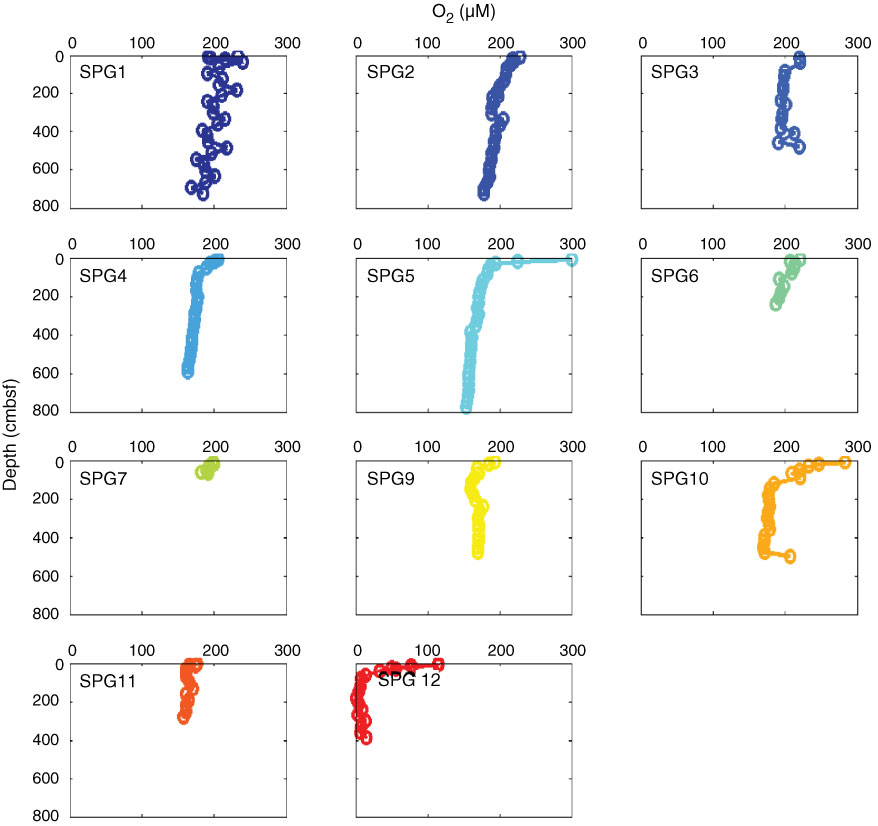
Figure F30. Plots of oxygen profiles measured on cores at all sites.
Previous | Close | Next | Top of page