Previous | Close | Next
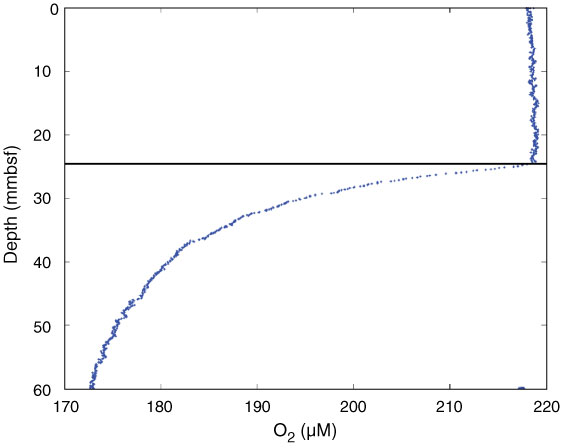
Figure F32. Plot of oxygen microprofile measured with the benthic lander in situ at Site SPG-10.
Previous | Close | Next | Top of page