Previous | Close | Next
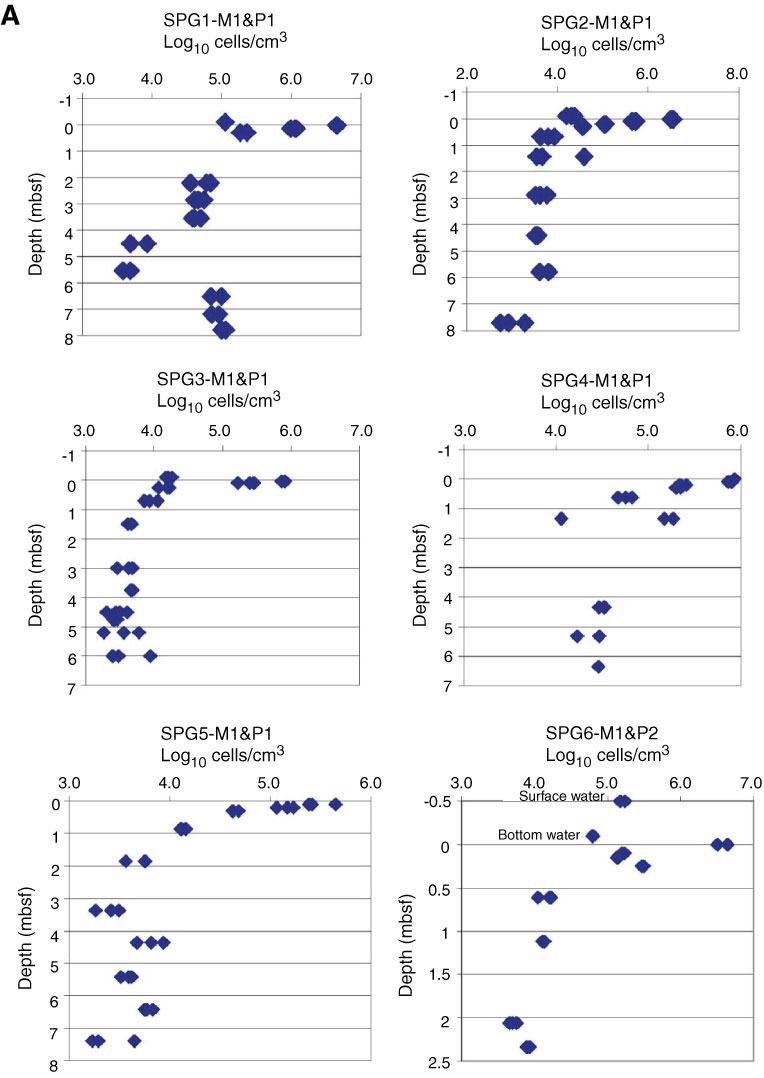
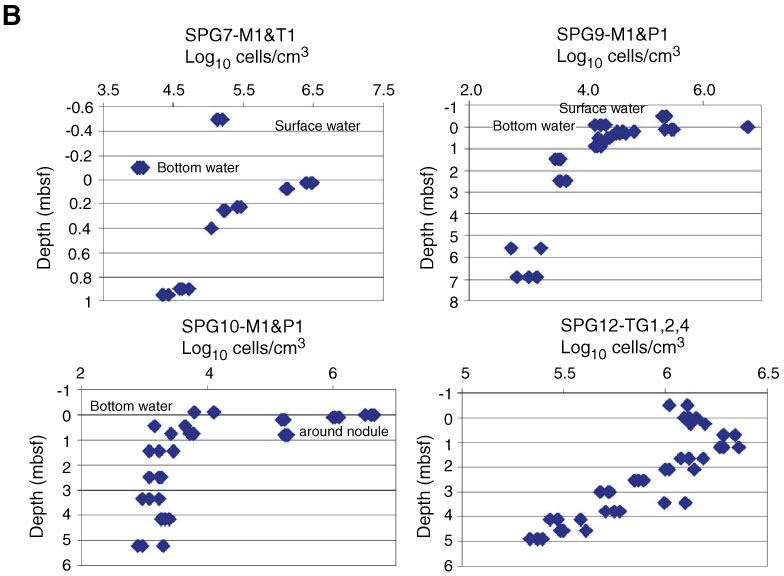
Figure F34. Plots of counted cell concentrations. A. Sites SPG-1–SPG-6. B. Sites SPG-7–SPG-12.
Previous | Close | Next | Top of page