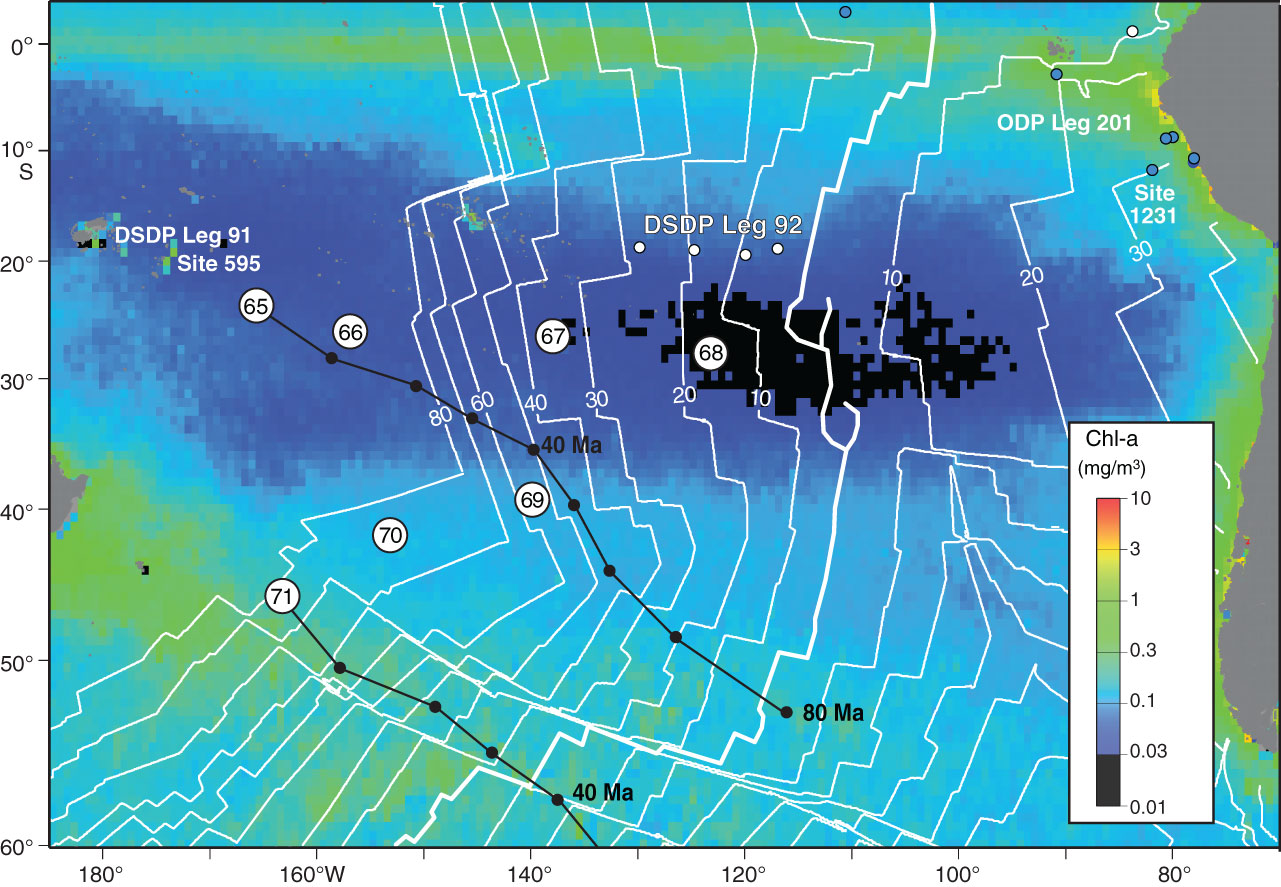
Figure F1. Map of annual chlorophyll-a concentrations overlain by Expedition 329 site locations (white circles). White lines indicate basement age in 10 m.y. increments. Black lines indicate site positions over geologic time (by D’Hondt et al., 2013).

Close | Next | Top of page