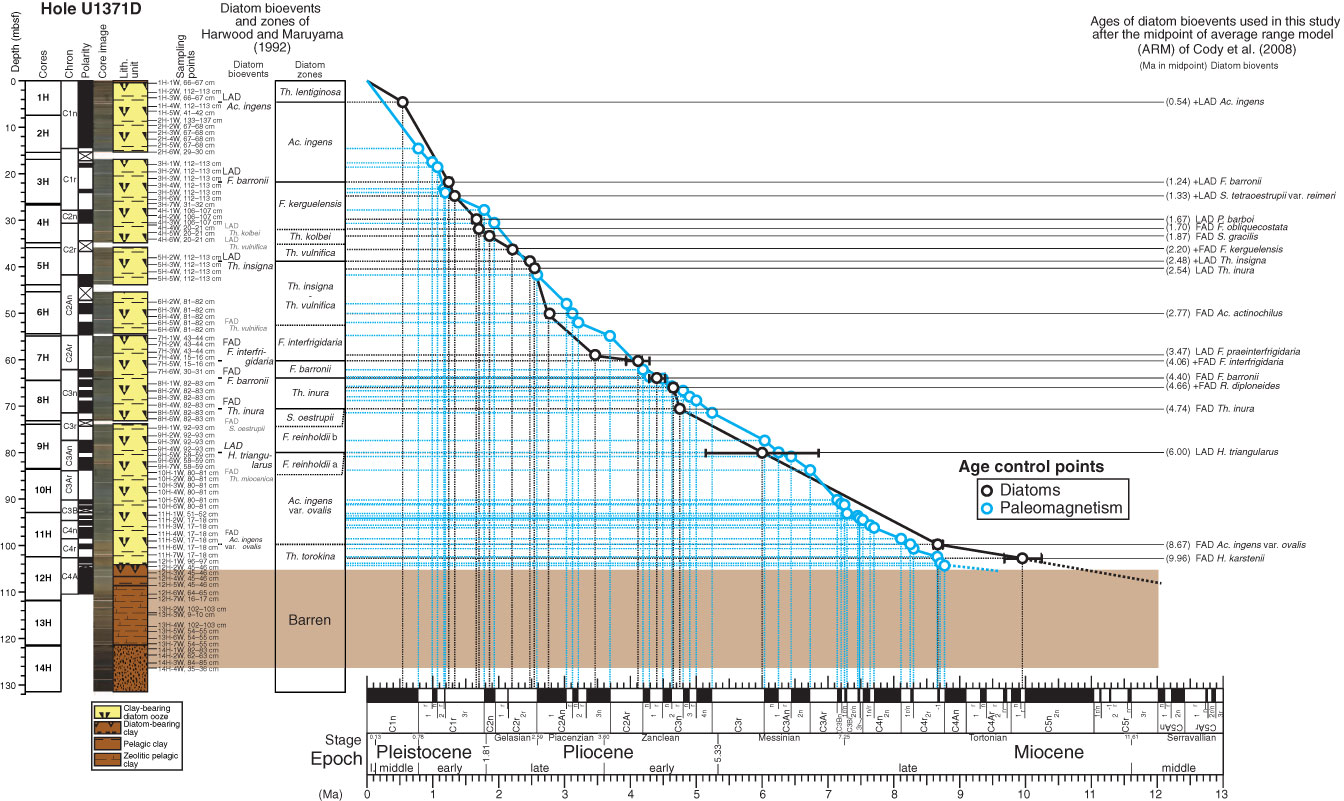
Figure F3. Age-depth plot, Hole U1371D. Ages of diatom bioevents are used after the midpoint of average range model of Cody et al. (2008). Polarity after the shipboard results in Expedition 329 Scientists (2011). Chron boundary ages after the geomagnetic polarity timescale of Ogg and Smith (2004).
Previous | Close | Top of page