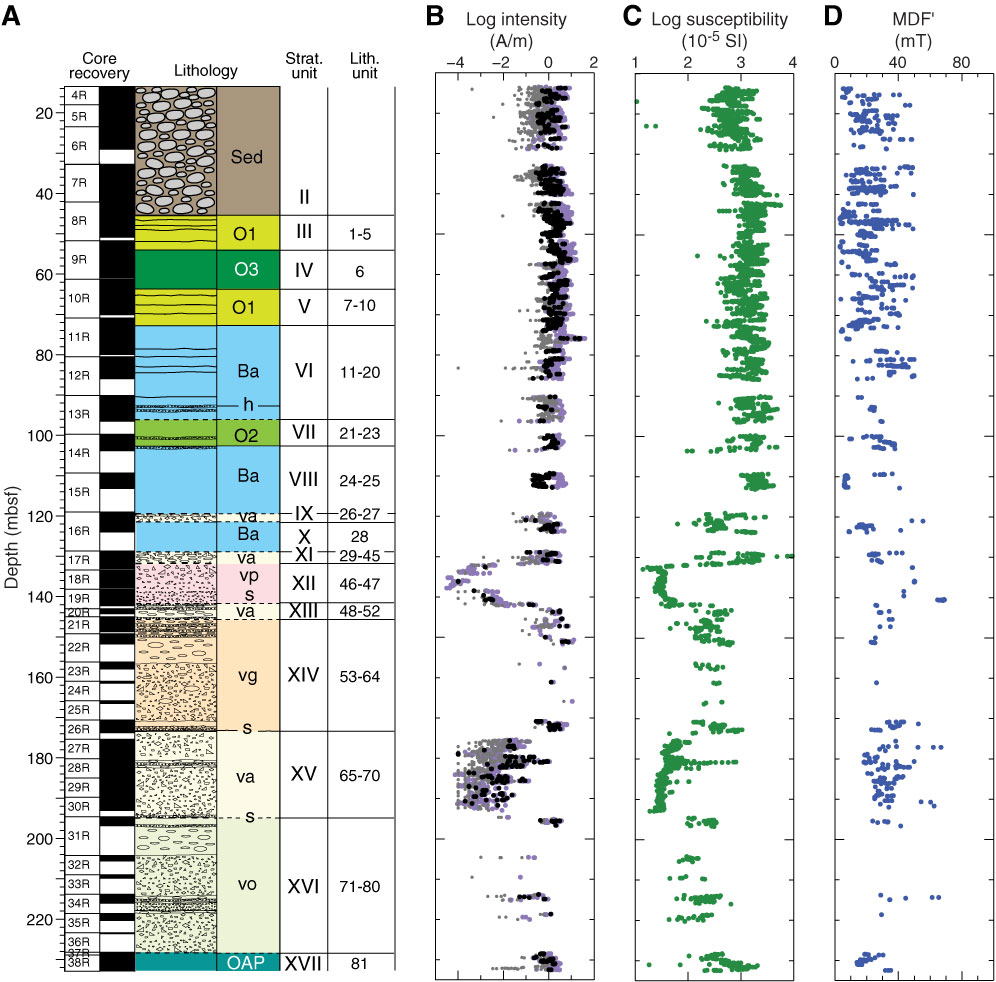
Figure F19. Downhole paleomagnetic data from archive-half cores, Site U1372. A. Core recovery and observed stratigraphy. See Figure F12 for an explanation of lithology and stratigraphic units. B. Downhole remanent intensity, showing natural remanent magnetization (purple) and principal component analysis (PCA) directions below (black) and above (gray) a threshold of fitting quality. C. WRMSL magnetic susceptibility. D. Median destructive field of the vector difference sum (MDF′), shown only for the more reliable intervals below the threshold of PCA fitting quality.

Previous | Close | Next | Top of page