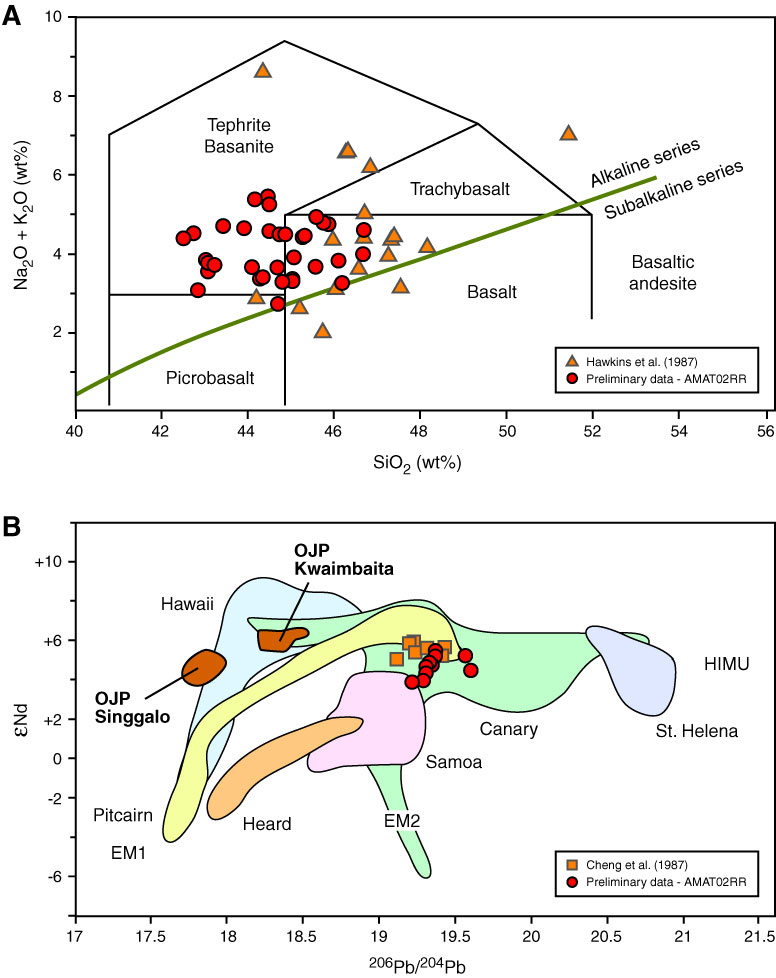
Figure F6. A. Alkalinity diagram of Le Bas et al. (1986), with division of alkaline vs. subalkaline (tholeiitic) series from MacDonald and Katsura (1964), showing an absence of tholeiitic rocks in the current sample suites for the Louisville Seamount Trail. B. Correlation plot for Nd and Pb isotopes, showing the remarkably homogeneous composition for Louisville samples spanning 80 m.y. Note the marked difference from the two Ontong Java Plateau (OJP) basalt groups. Similarly homogeneous signatures are evident in the HFSE Zr/Y and Nb/Y trace element ratios (not shown). These diagrams include published data from Hawkins et al. (1987) and Cheng et al. (1987), as well as unpublished data from the AMAT02RR site survey cruise (L. Vanderkluysen). EM = enriched mantle, HIMU = “high µ” (high, time-integrated 238U/204Pb ratios).
Previous | Close | Next | Top of page