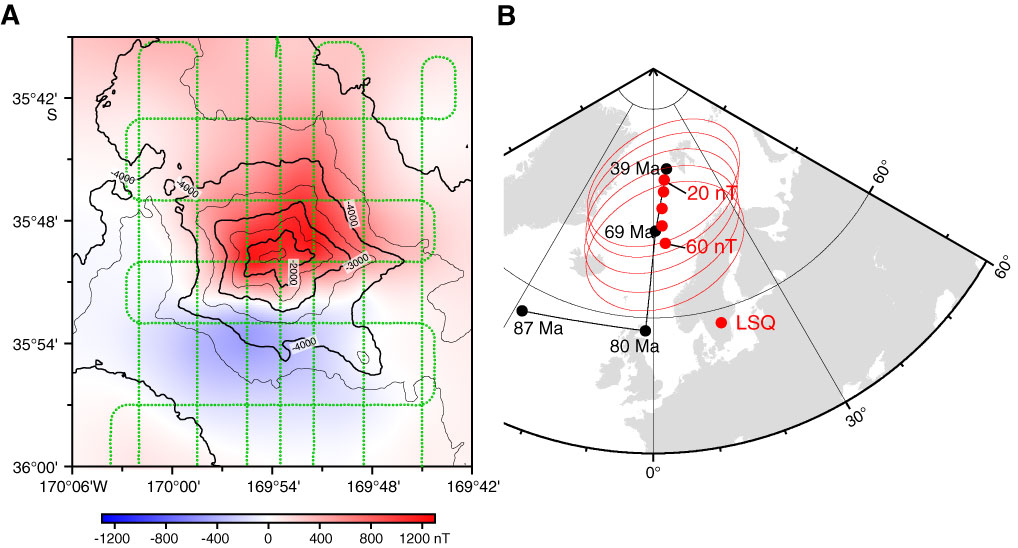
Figure F8. Magnetic anomaly pattern and paleopole positions for the 35.8°S seamount. A. Relatively simple magnetic anomaly pattern (red/blue scale) and topography (black lines = 500 m contours). Survey track shown as dashed green line. B. Paleopole positions (and 95% confidence bounds in red) derived from the uniform magnetization component for misfits of 60–20 nT compared to Pacific poles from Sager and Pringle (1987) (black). LSQ = least-squares solution.
Previous | Close | Next | Top of page