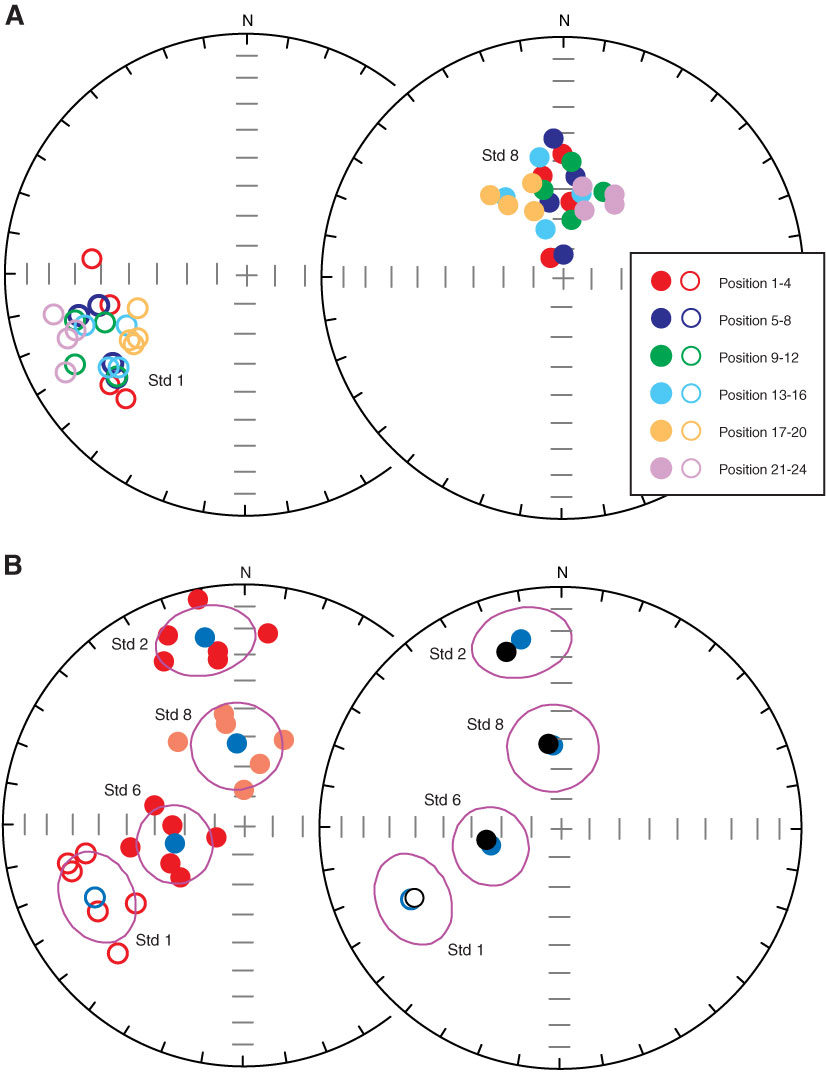
Figure F17. Equal-area plots showing discrete sample magnetization directions from standards (Std) measured in several positions on the cryogenic magnetometer. Open symbols = upper hemisphere, solid symbols = lower hemisphere. A. Representative results for two standard samples measured in all 24 positions using the SRM_DISCRETE program. Colors denote groups of orientations related by rotation about a common specimen coordinate axis. B. Results for four standards measured in a subset of six positions on the cryogenic magnetometer. Means and associated 95% confidence ellipses are indicated by blue circles and purple ellipses, respectively. These means are compared with the accepted values for these standards (black circles).
Previous | Close | Next | Top of page