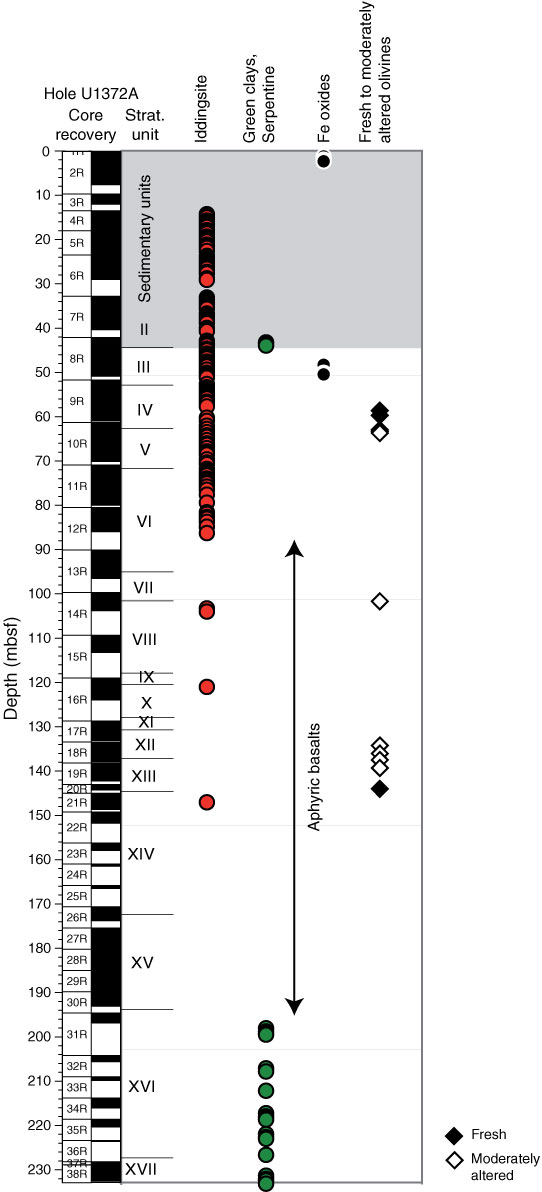
Figure F31. Plot of downhole distribution of secondary minerals after olivine for each interval defined by the alteration petrology group. Symbols are located at center depth for each interval. Note the paucity of olivine between 80 and 200 mbsf, corresponding to aphyric basalts. Occurrences of fresh to slightly altered olivines are based on macroscopic observations; for thin section observations, see Table T7. Gray shading represents sedimentary units.
Previous | Close | Next | Top of page