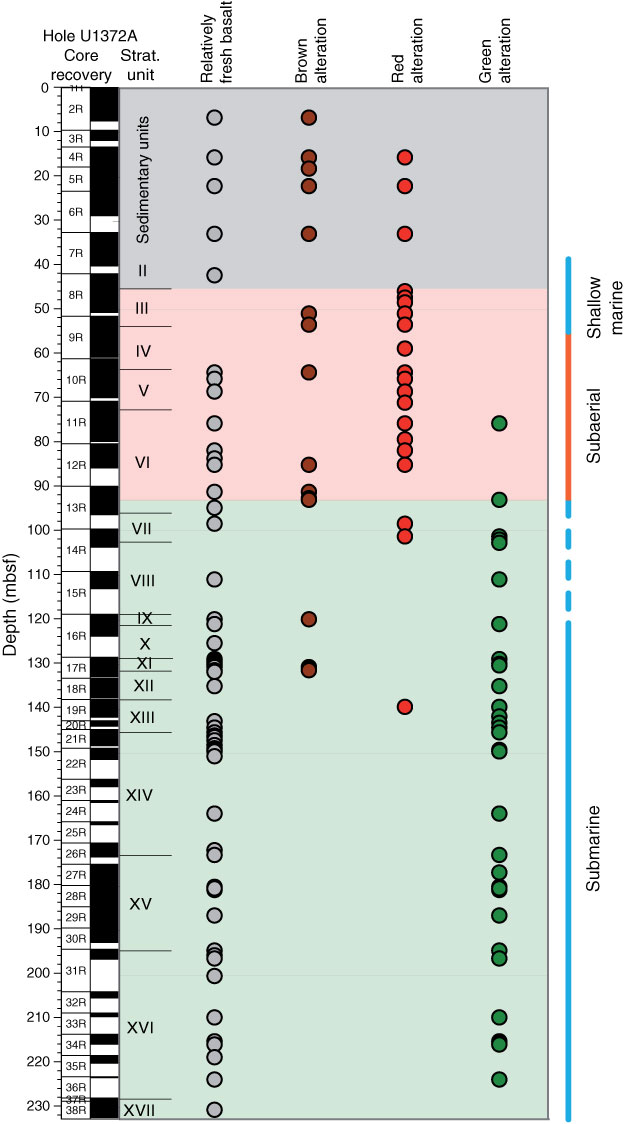
Figure F34. Plot of downhole distribution of main alteration colors representing overall color of each lithologic unit (defined by the igneous petrology group). Circles are located at center depth for each lithologic unit. For some units, especially those where volcanic clasts are surrounded by a volcanic matrix, the color of both clasts and cement is reported. Gray shading represents sedimentary units, pink shading represents red/brown oxidized basalts, green shading represents greenish, reduced rocks.
Previous | Close | Next | Top of page