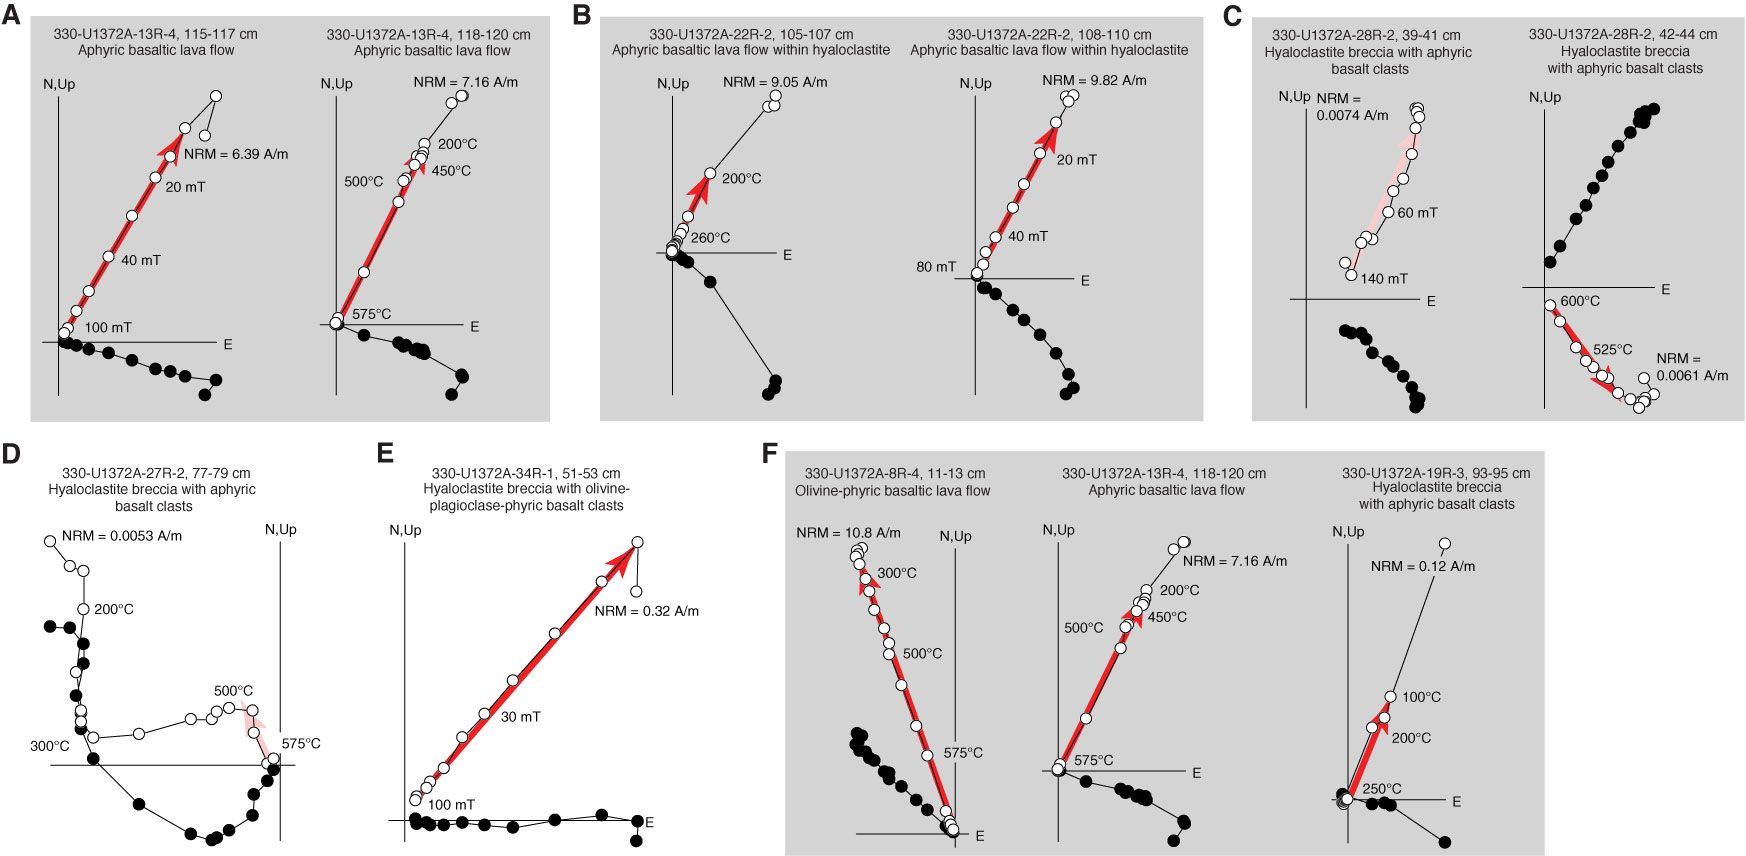
Figure F65. A–F. Representative Zijderveld plots of stepwise AF and thermal demagnetization results from discrete samples, Hole U1372A. Solid circles = projections of vector endpoints onto horizontal plane, open circles = projections onto vertical plane. Red arrows = PCA direction, pink arrows = rejected PCA directions with maximum angular deviation > 5°. A–C show AF and thermal demagnetization results from adjacent samples within (A, B) basalt and (C) volcaniclastic units. F shows samples exhibiting different magnetic mineralogy, as inferred from unblocking temperatures. NRM = natural remanent magnetization.
Previous | Close | Next | Top of page