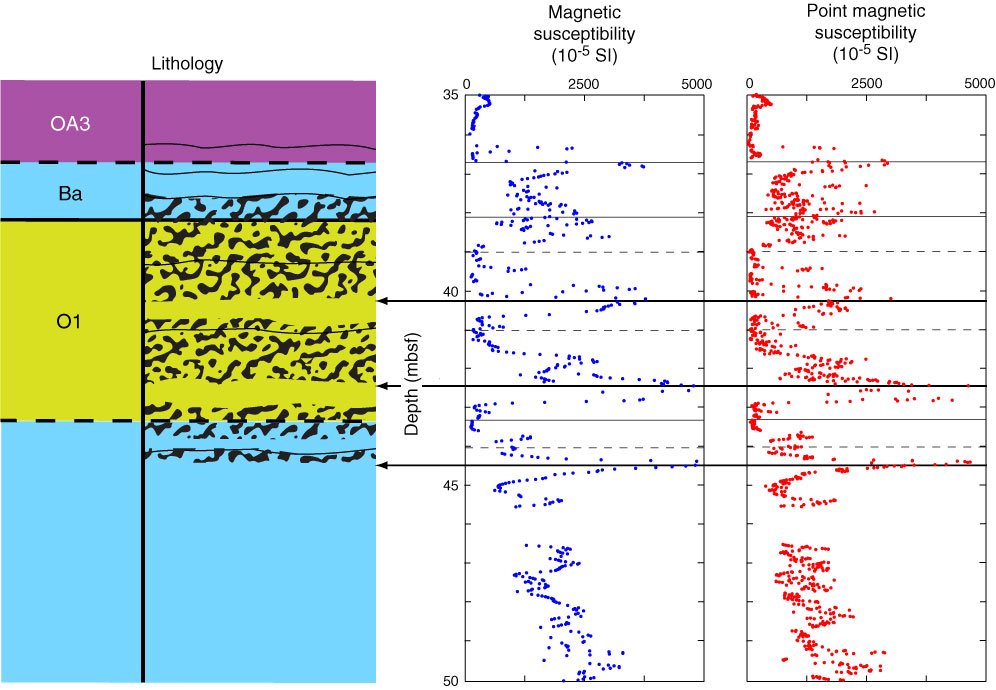
Figure F45. Close-up depth profiles of magnetic susceptibility for interval of 35–50 mbsf, Hole U1373A. Oscillations from high to low magnetic susceptibility correlate with boundaries between peperitic and more massive lava flows. Arrows mark two peaks in magnetic susceptibility in Unit VI and one peak near the top of Unit VII at 44.5 mbsf. Solid lines in magnetic susceptibility plots = stratigraphic unit boundaries, dashed lines = lithologic unit boundaries in stratigraphic Units VI and VII.
Previous | Close | Next | Top of page