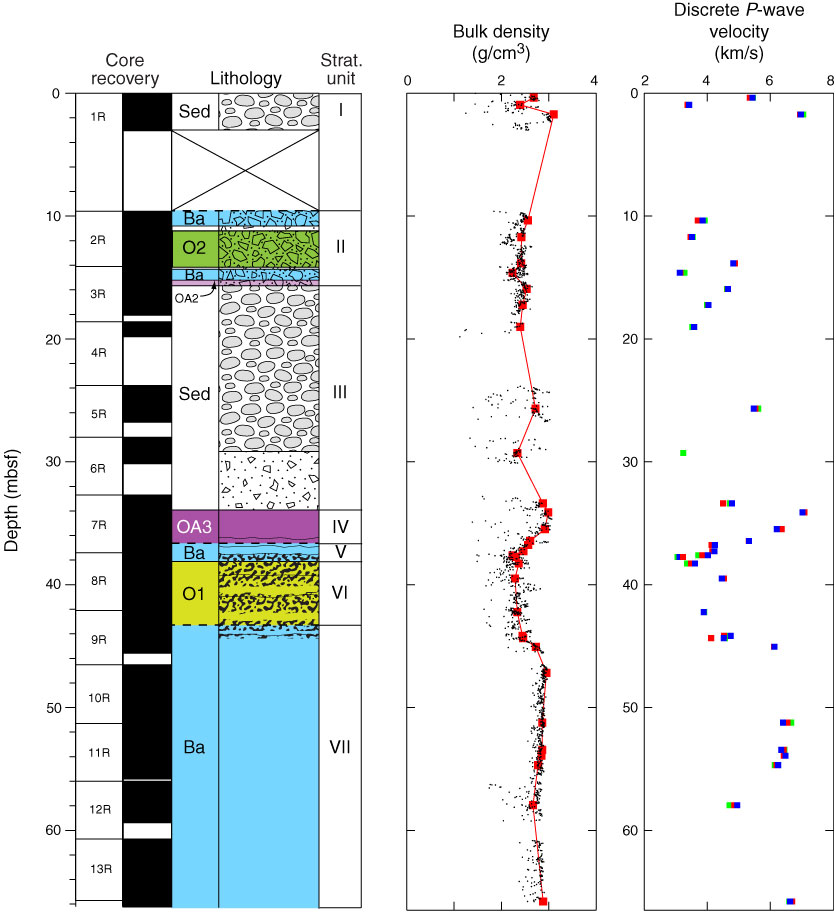
Figure F47. Depth profiles of bulk density and discrete P-wave velocity for Hole U1373A, shown with corresponding stratigraphic column. Bulk density: red squares = moisture and density Method C measurements taken on discrete samples, black dots = GRA bulk density. P-wave velocity: blue = x-axis (normal to the split-core surface), red = y-axis (parallel to the split-core surface), green = z-axis (downcore). For explanation of stratigraphy, see Figure F11.
Previous | Close | Next | Top of page