Previous | Close | Next
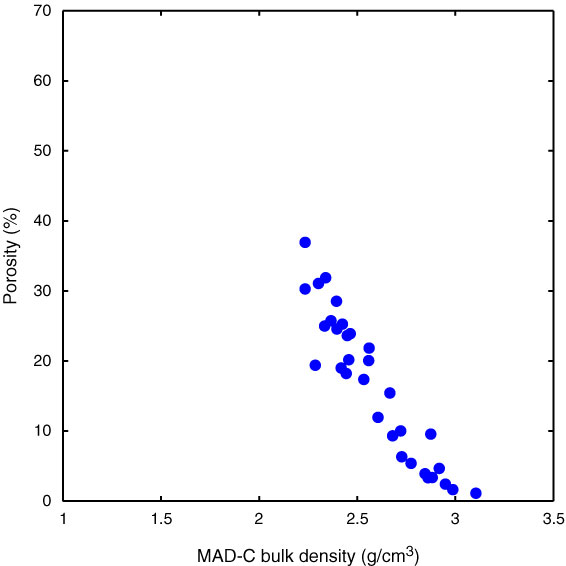
Figure F50. Plot of moisture and density Method C (MAD-C) bulk density values vs. porosity of discrete samples, Hole U1373A. Results show an approximately linear negative correlation.
Previous | Close | Next | Top of page