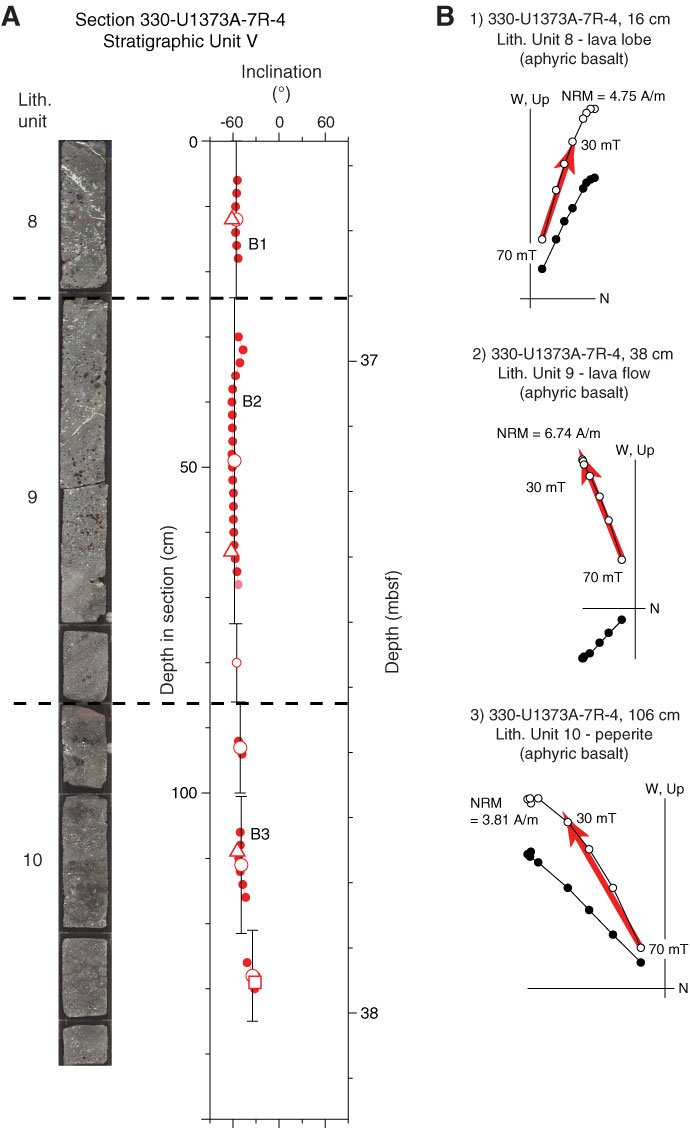
Figure F56. (A) Downhole inclination variation and (B) representative Zijderveld plots, Section 330-U1373A-7R-4 (lithologic Units 8–10). In Zijderveld plots, solid circles = projections of vector endpoints onto horizontal plane, open circles = projections onto vertical plane. Red arrows = best fitting PCA direction calculated automatically and selected on basis of lowest misfit (solid red symbols in A). In A, pink circles = PCA directions with misfit > 3.42, open circles with error bars = Fisher piece averages. Discrete AF (triangles) and thermal (squares) demagnetization directions are also shown. NRM = natural remanent magnetization.
Previous | Close | Next | Top of page