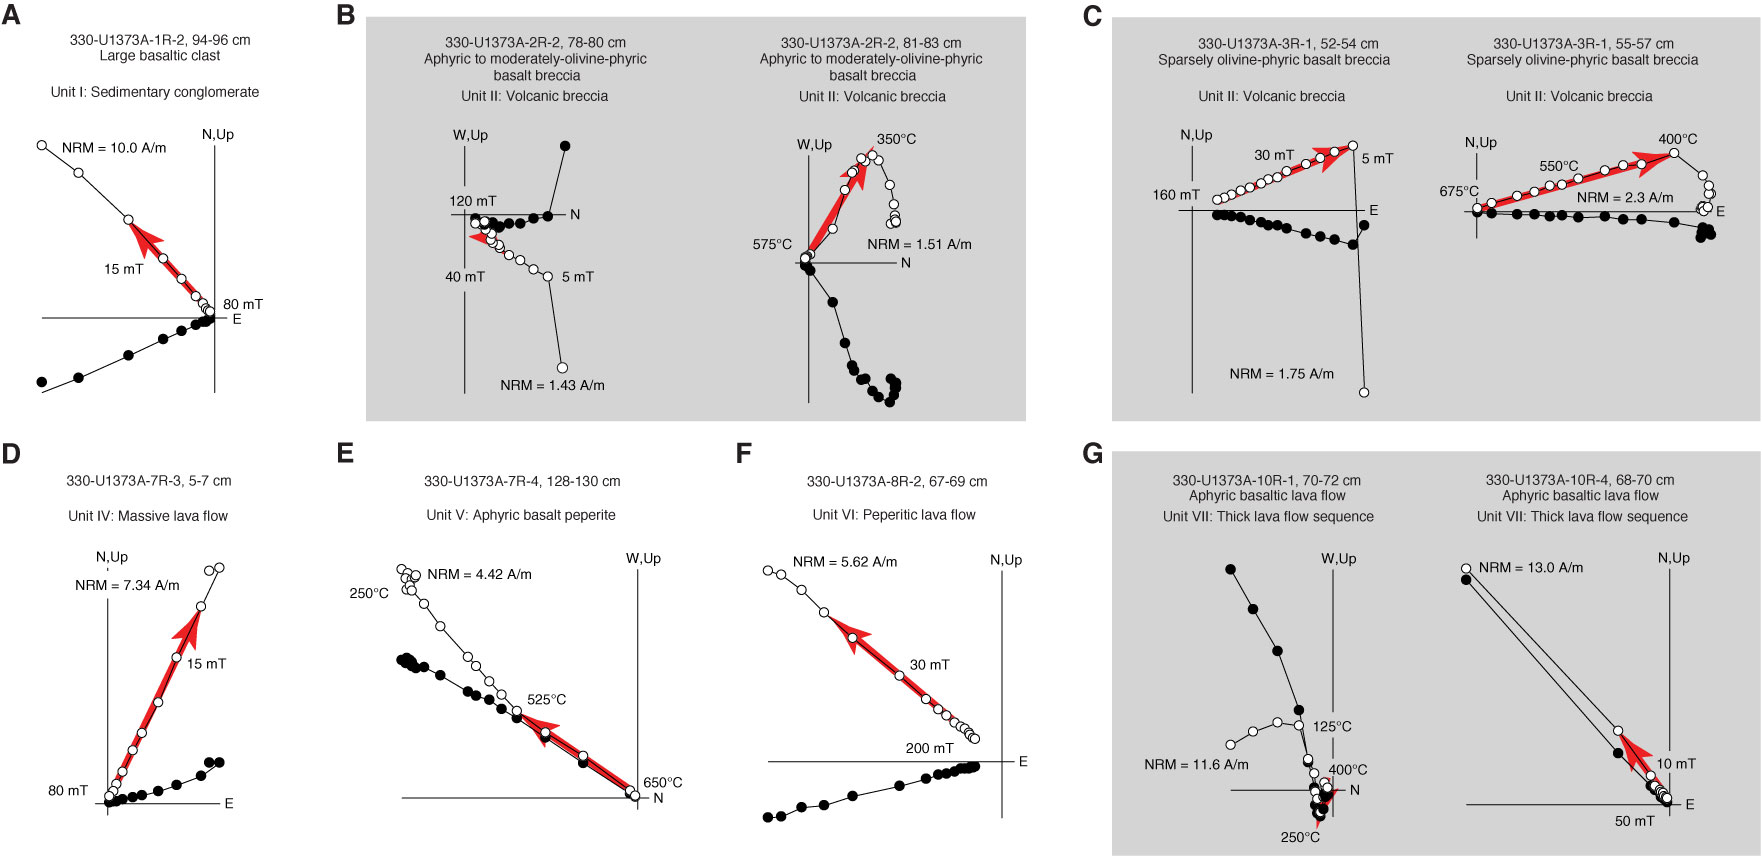
Figure F58. A–G. Representative Zijderveld plots of AF and thermal demagnetization results from discrete samples, Hole U1373A. Solid circles = projections of vector endpoints onto horizontal plane, open circles = projections onto vertical plane. Red arrows = PCA direction with maximum angular deviation ≤ 5°. B and C show AF and thermal demagnetization results from adjacent samples. G shows AF and thermal demagnetization results from samples in same stratigraphic unit. NRM = natural remanent magnetization.
Previous | Close | Next | Top of page