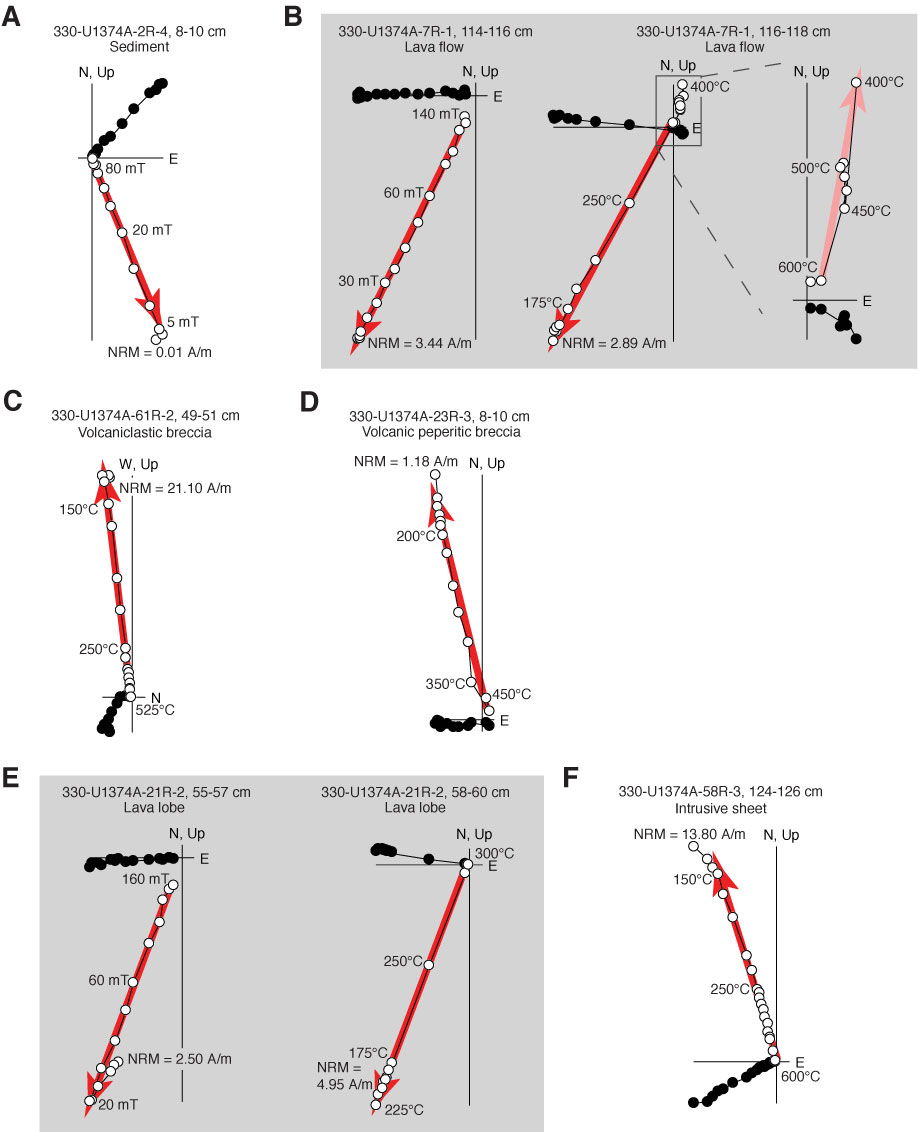
Figure F76. A–F. Representative Zijderveld plots of AF and thermal demagnetization results from discrete samples, Hole U1374A. Solid circles = projections of vector endpoints onto horizontal plane, open circles = projections onto vertical plane. Red arrows = principal component analysis (PCA) direction, pink arrows = rejected PCA directions with maximum angular deviation > 5°. B and E show results of thermal and AF demagnetization from adjacent samples.
Previous | Close | Next | Top of page