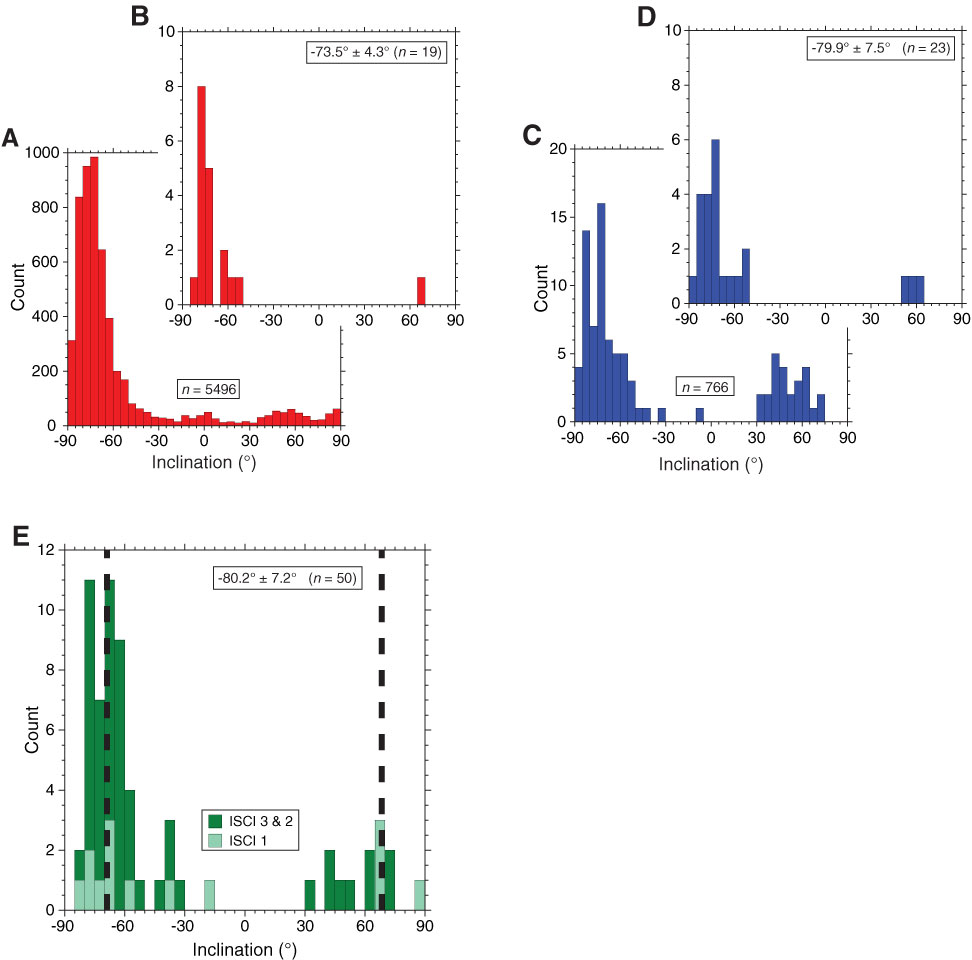
Figure F79. Histograms of Hole U1374A inclinations. A. All archive-half cores measured at 2 cm intervals with misfit ≤ 3.42. B. Lithologic unit averages of data in A using inclination-only statistics for units with an in situ confidence index (ISCI; see “Igneous petrology and volcanology” in the “Methods” chapter [Expedition 330 Scientists, 2012a]) of 3 or 2 and with α95 ≤ 30°. C. Fisher piece-average inclinations (CSD ≤ 20°) for units assigned an ISCI of 3 or 2. D. Lithologic unit averages of data in C using inclination-only statistics and with α95 ≤ 40°. E. Inclinations from AF or thermally demagnetized discrete samples. Dashed lines in E indicate expected geocentric axial dipole inclination (±68°) for current Louisville hotspot location. Statistics presented in inset panels are inclination-only means (α95). Note different scales on y-axes and that because of the uncertainty in whether some individual units are in situ, averages by lithologic unit have not been calculated.
Previous | Close | Next | Top of page