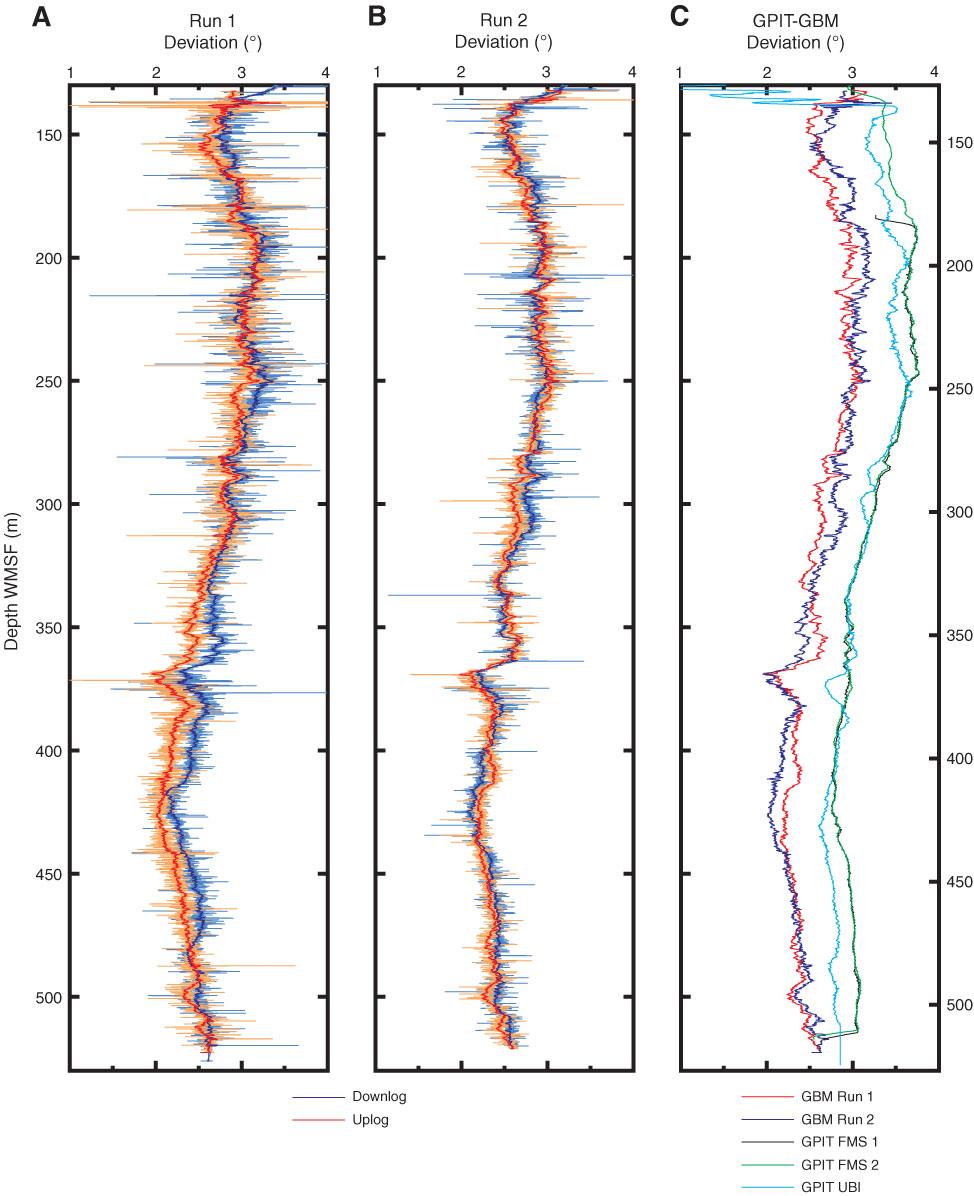
Figure F86. Borehole deviation from vertical determined during (A) Run 1 and (B) Run 2 with the Göttingen Borehole Magnetometer (GBM) (downlog and uplog) and (C) comparison with deviation determined by the General Purpose Inclinometry Tool (GPIT) in the Formation MicroScanner (FMS)-sonic and Ultrasonic Borehole Imager (UBI) tool strings, Hole U1374A. The light colors in A and B show raw GBM data, and dark colors show 16-point moving average, which is also shown in C.

Previous | Close | Next | Top of page