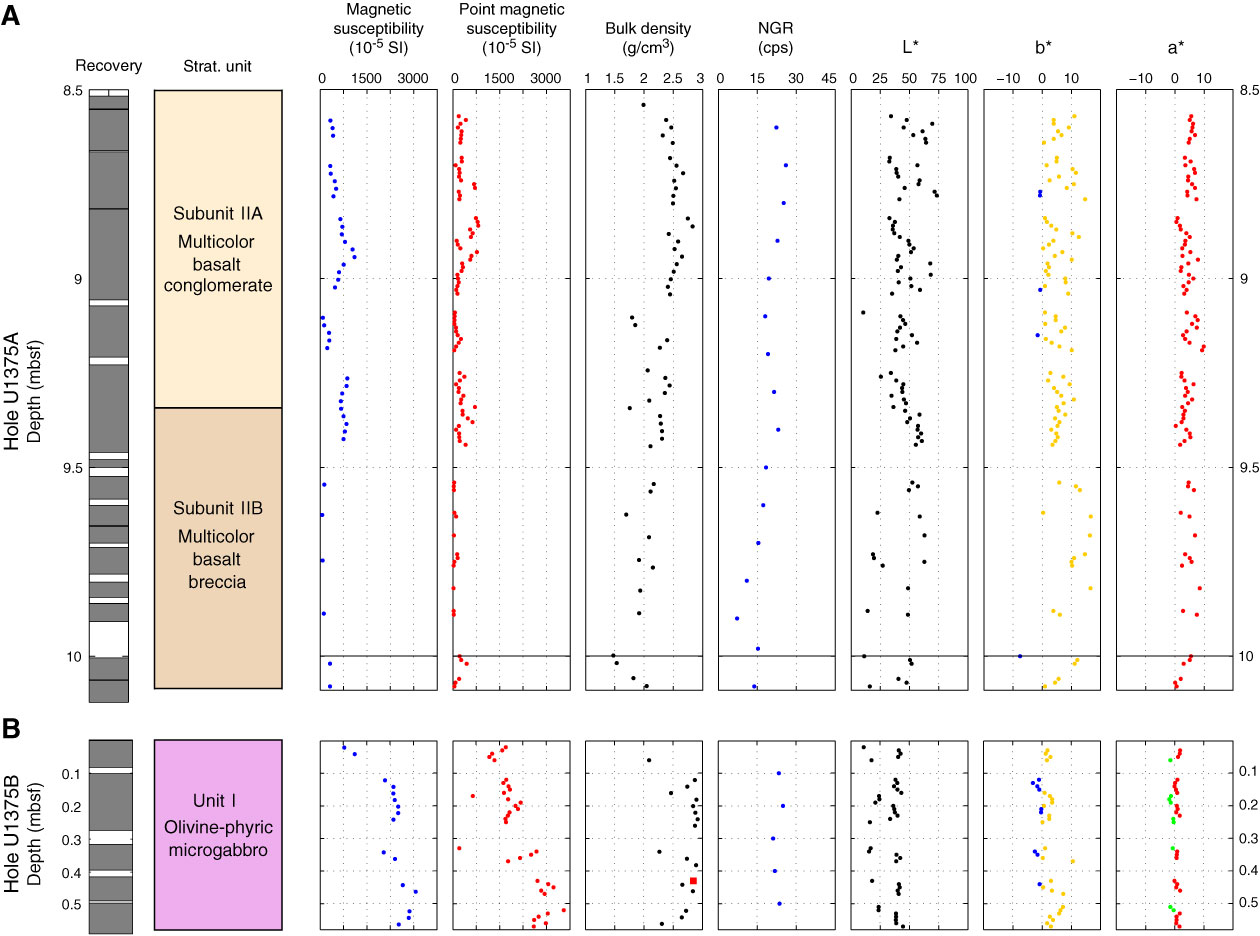
Figure F12. Depth profiles of physical property measurements, (A) Hole U1375A and (B) Hole U1375B. In recovery column, black lines indicate cracks and white intervals indicate gaps between separate pieces, as determined by laser scanner. Stratigraphic columns for each hole are shown for reference. Bulk density: black dots = GRA bulk density, red square = moisture and density method C measurement on Sample 330-U1375B-1R-1W, 43–45 cm. Higher values of L* indicate lighter colors, a* = relative color position between red (positive) and green (negative), b* = relative color position between yellow (positive) and blue (negative). NGR = natural gamma radiation.
Previous | Close | Top of page