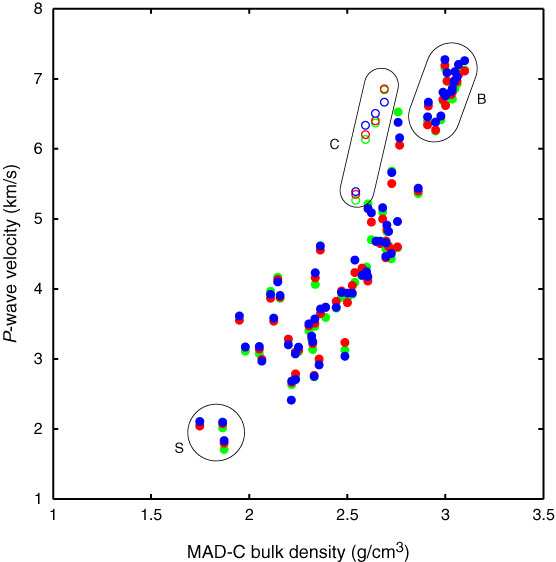
Figure F49. Plot of moisture and density Method C (MAD-C) bulk density values from discrete samples vs. discrete P-wave velocity, Hole U1376A, showing an approximately linear relationship. Colors represent different orientations for P-wave velocity measurements: blue = x-axis (normal to the split-core surface), red = y-axis (parallel to the split-core surface), green = z-axis (downcore). Measurements on carbonate samples are shown as open circles and labeled “C”; measurements in the massive lava flows of lithologic Units 12, 15, 17, and 29 are labeled “B”; and those in volcanic sandstone are labeled “S.”
Previous | Close | Next | Top of page