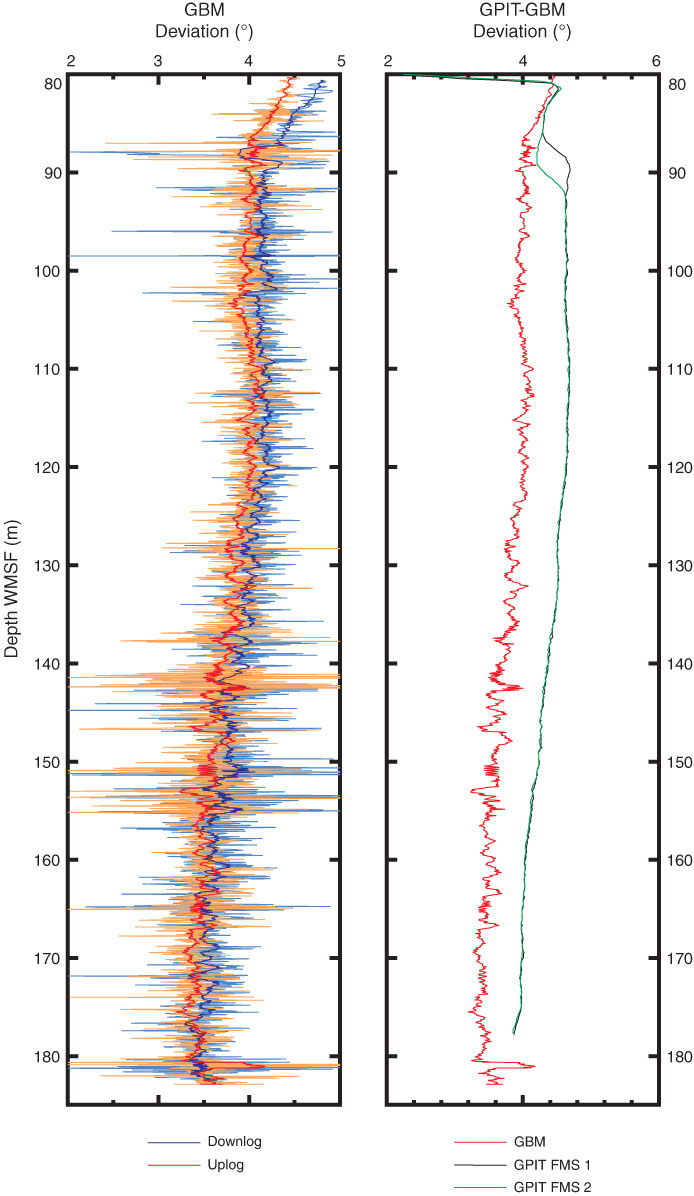
Figure F62. Plots of borehole deviation from vertical determined during Göttingen Borehole Magnetometer (GBM) run (downlog and uplog) and comparison with deviation determined by the General Purpose Inclinometry Tool (GPIT) in the Formation MicroScanner (FMS)-sonic tool string, Hole U1376A. The light colors in the GBM plot show raw data, and the dark colors show 16-point moving average, which is also shown in comparison plot.
Previous | Close | Next | Top of page