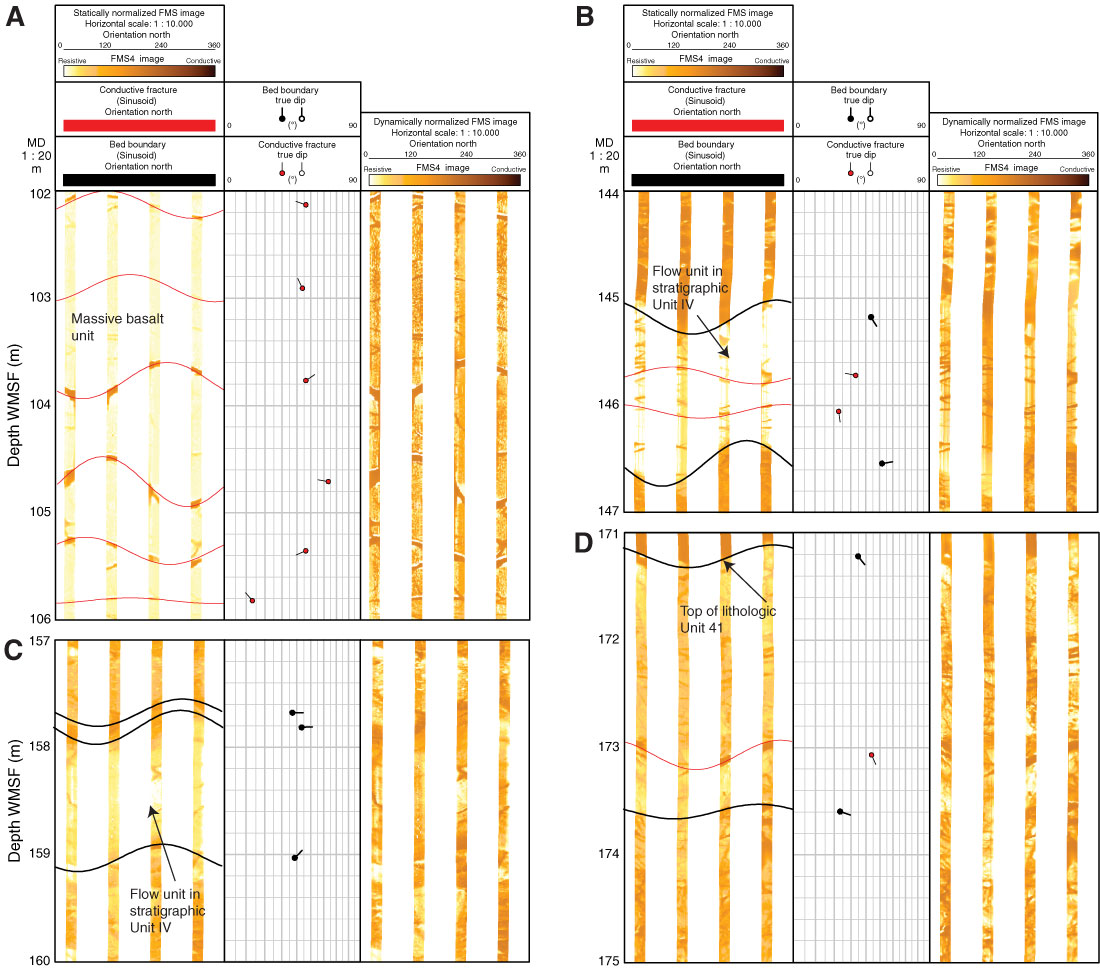
Figure F70. Summary figure of Formation MicroScanner (FMS) images showing examples of structural relationships, Hole U1376A. Note that images are from one FMS pass. Best-fit sinusoids were picked on major features (black = bed boundaries/unit boundaries, red = conductive fractures), and tadpole plots of dip angles and directions are shown next to FMS image (note that direction of tadpole tail indicates true azimuth of dip, and angle of dip is where circle is plotted). Both static- and dynamic-normalized FMS images are shown. A. Numerous conductive fractures in massive basalt unit. B, C. Boundaries on either side of flow units in stratigraphic Unit IV. D. Top surface of lithologic Unit 41. For more details on aforementioned lithologic and stratigraphic units, see “Igneous petrology and volcanology.”
Previous | Close | Next | Top of page