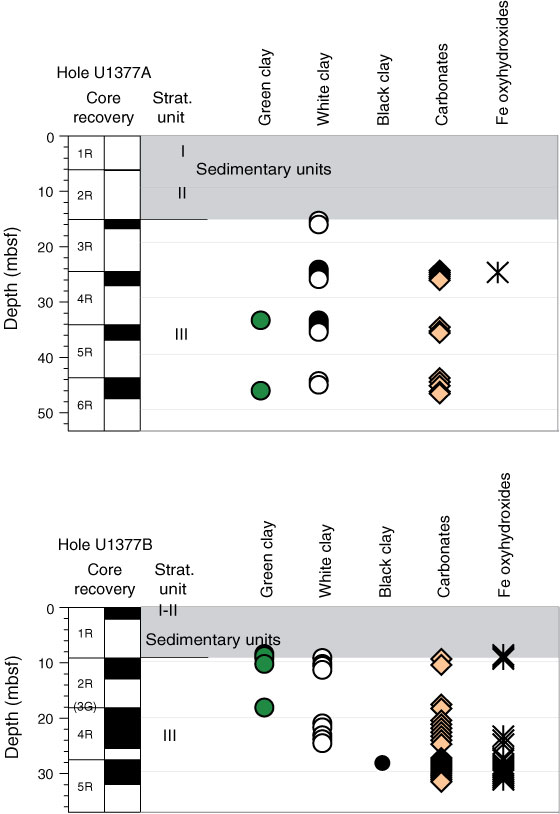
Figure F18. Plot of downhole distribution of secondary minerals infilling vesicles for each alteration interval defined by the alteration petrology group. Symbols are located at center depth for each interval. Gray shading represents sedimentary units.
Previous | Close | Next | Top of page