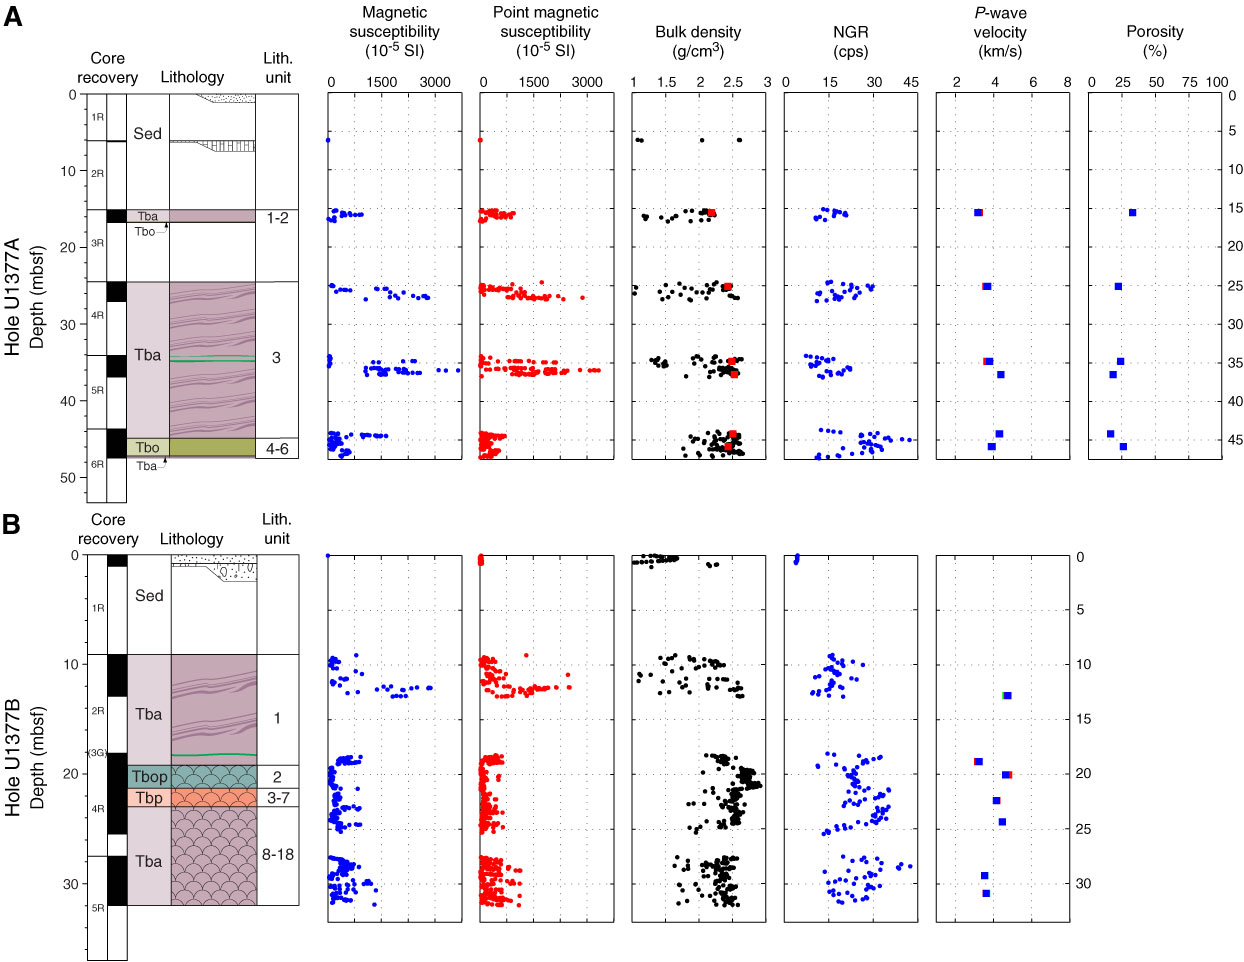
Figure F25. Depth profiles of physical property measurements, (A) Hole U1377A and (B) Hole U1377B. Stratigraphic columns for each hole are shown for reference. For explanation of stratigraphy, see Figure F8. The vertical scale for each hole is different to reflect the different levels of recovery. Bulk density: black dots = GRA bulk density, red squares = moisture and density Method C (MAD-C) measurements on discrete samples from Hole U1377A. P-wave velocity: blue = x-axis (normal to the split-core surface), red = y-axis (parallel to the split-core surface), green = z-axis (downcore). Porosity from measurements on discrete samples is shown for Hole U1377A only. NGR = natural gamma radiation.
Previous | Close | Next | Top of page