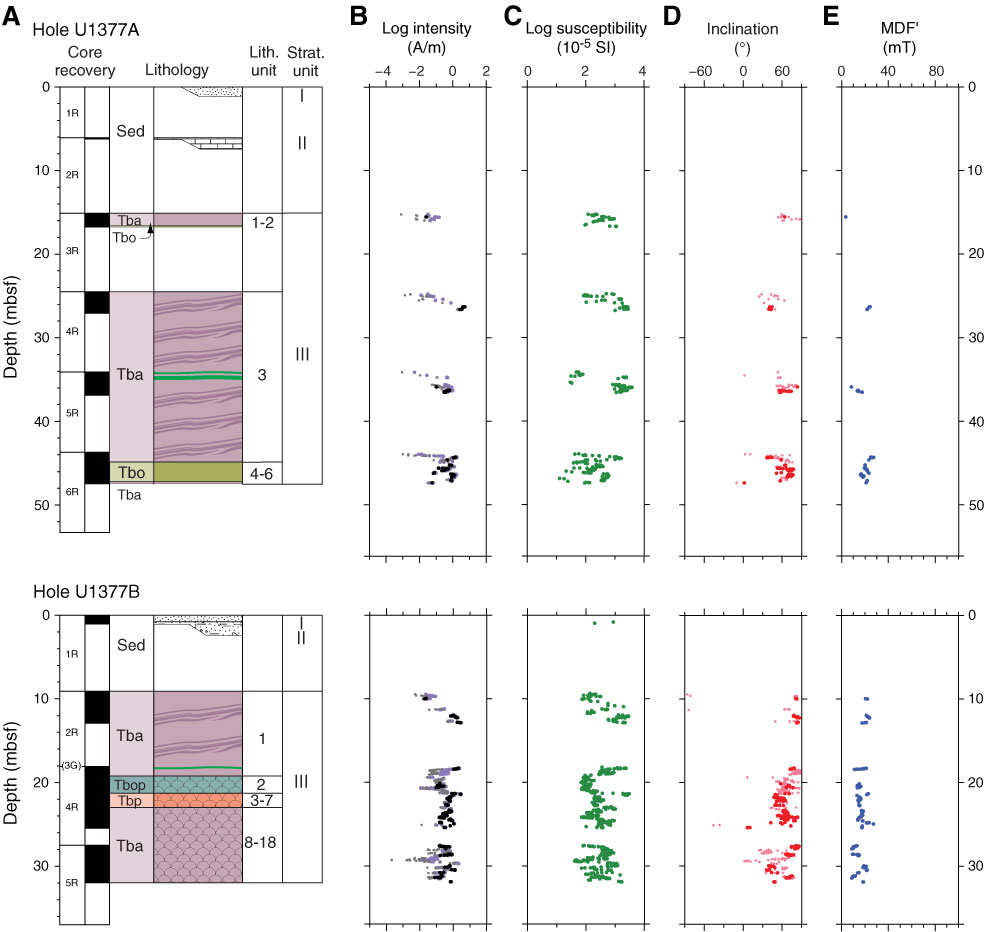
Figure F27. Downhole plots of paleomagnetic data from archive-half cores, Hole U1377A and U1377B. A. Core recovery and observed stratigraphy (see Fig. F8 for explanation of patterns and abbreviations). B. Remanent intensity variations: purple = NRM intensities, black = intensities associated with principal component analysis (PCA) directions with misfits ≤ 2.42 (Hole U1377A) and ≤ 1.89 (Hole U1377B), gray = intensities associated with PCA directions with misfits > 2.42 (Hole U1377A) and > 1.89 (Hole U1377B). C. WRMSL magnetic susceptibility (see “Physical properties”). D. Inclination: red = PCA directions with misfits ≤ 2.42 (Hole U1377A) and ≤ 1.89 (Hole U1377B), pink = PCA directions with misfits > 2.42 (Hole U1377A) and > 1.89 (Hole U1377B). E. Median destructive field of the vector difference sum (MDF′), shown only for intervals with low misfits.
Previous | Close | Next | Top of page